Key Takeaways from the June New Home Sales Report

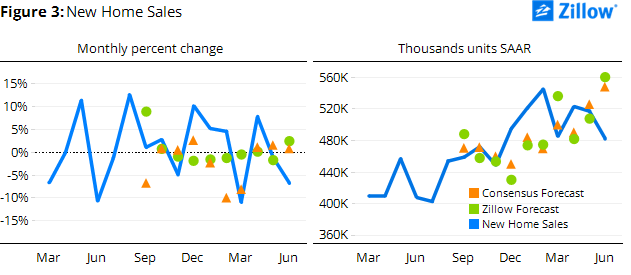
Sales of newly constructed homes fell 6.8 percent in June, according to the U.S. Census Bureau, to a seasonally adjusted annual rate (SAAR) of 482,000 units, surprising most observers (including us). Still, sales of new homes in June were 18 percent higher than in June 2014, and were higher last month than in all but six months in the past seven years (since June 2008).
May’s new home sales data were also revised lower, from 546,000 units SAAR to 517,000 units SAAR. Instead of increasing 2.2 percent between April and May, as initially reported by the Census Bureau, monthly new home sales now appear to have declined 1.1 percent in May.
 The monthly decline in June was largest in the Western United States (-17 percent), perhaps partly attributable to a retreat from May’s exceptionally strong sales in the West. The Northeast experienced a month-over-month increase in sales (+28 percent) in June. Compared to a year ago, sales are higher in all major regions, notably the South and Midwest (both up about 23 percent over the year).
Inventory of new homes on market – the months’ supply available – increased from 4.8 months to 5.4 months, suggesting that that change in June was driven mostly by weak demand, rather than short supply.
Median, seasonally-adjusted prices of new U.S. homes edged up 2.1 percent from May, to $281,800, but were 1.8 percent lower than June 2014 – the second consecutive month of annualized declines in new home prices. Compared to the November 2014, post-crisis peak of $307,699, the median sales price of new homes is down 7.7 percent. Despite this retreat, compared to the pre-crisis peak of $266,978, prices are up 6.4 percent.
