Boom, Bust & Recovery: The Rollercoaster Ride of Las Vegas Housing in the 21st Century

On October 14, Zillow will make Las Vegas the sixth stop on its Housing Roadmap to 2016 tour of America, aimed at discussing housing challenges in the cities most impacted by them. And while Vegas has a number of housing challenges, none have proven more troublesome – and long-lasting – than negative equity.
One in four homeowners with a mortgage in the Las Vegas metro, or more than 83,000, are in negative equity, or underwater – owing more on their home than it is currently worth. And this says nothing of the 3.4 percent of Las Vegas homeowners who owe twice or more what their home is worth to the bank, the highest rate among large markets nationwide. Home values in Las Vegas remain almost 40 percent below their pre-recession peaks, and as home value growth slows, it’s increasingly likely that many homes may never attain those values again.
In advance of our trip, we will take a deep dive into the negative equity problem in Las Vegas, as well as explore the market’s housing basics. All of our Las Vegas-specific research can be found here.
We invite you to please join Zillow and our co-hosts at the Lied Institute for Real Estate Studies at the University of Nevada, Las Vegas, on October 14. If you can’t make it, don’t worry! Please follow and contribute to the discussion on social media using the hashtag #HousinginAmerica. We look forward to hearing from you.
No other large city in the country felt the housing boom and bust like Las Vegas did.
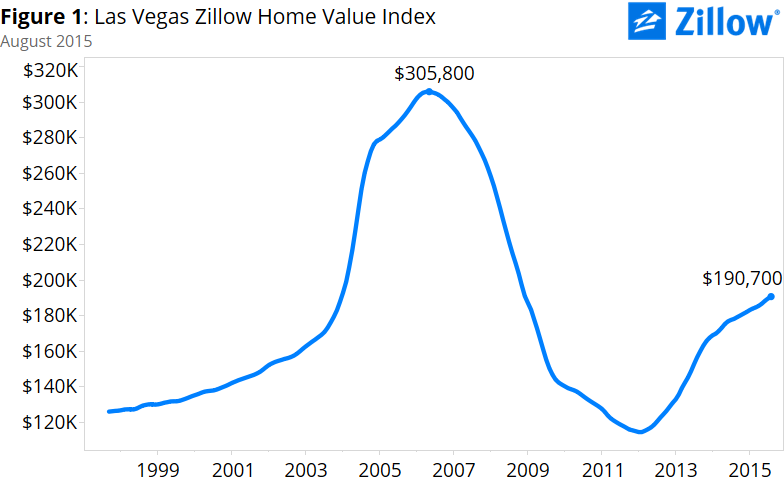 During the boom, Las Vegas builders constructed thousands of homes. Almost half (44 percent) of Vegas’ housing stock was built after 2000. Those homes were built to capitalize on the area’s enormous growth during the early part of last decade. Home values more than doubled between January 2000 and their pre-recession peak in May 2006, rising more than 125 percent. Between January 2004 and May 2006 alone, median home values grew 58 percent in Las Vegas – an incredibly high rate of appreciation in an incredibly short time (figure 1).
 Unfortunately for local residents, the housing bust was – amazingly – more intense than the housing boom.
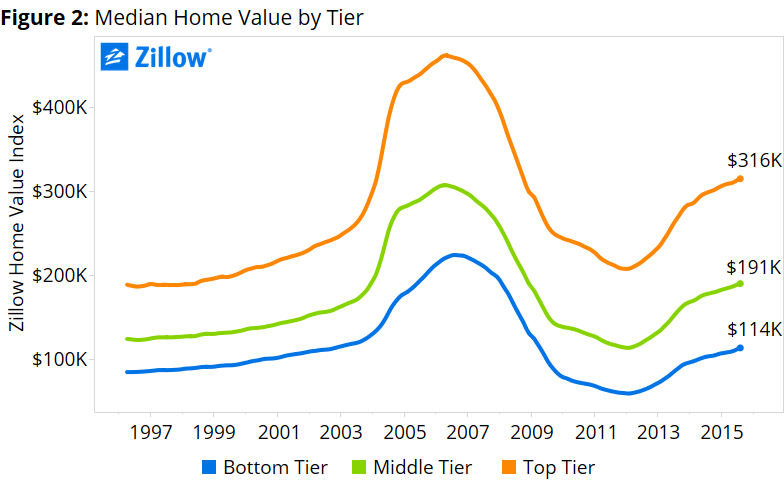
Between the market’s peak in May 2006 and its bottom in January 2012, the median Las Vegas home lost almost 63 percent of its value. And different segments of the market were affected to differing degrees. Homes valued in the bottom one-third of all homes lost a median of 74 percent of their value, while median home values in the top third fell by 55 percent (figure 2).
These losses created enormous amounts of negative equity.
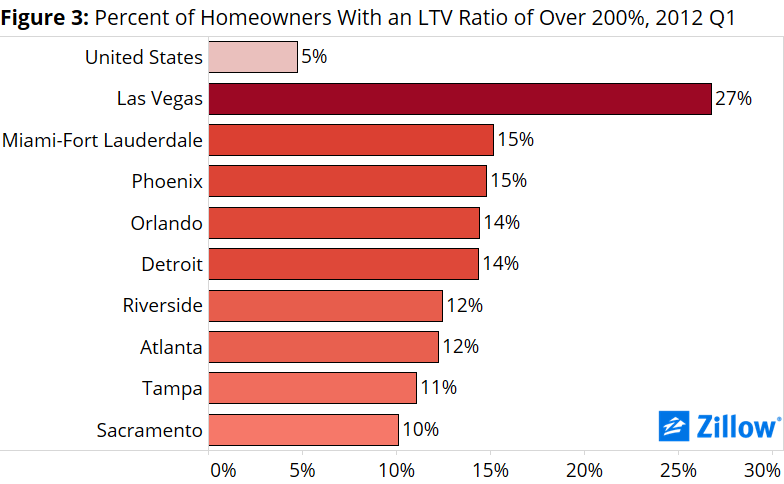 At its worst in Q1 2012, the negative equity rate in Las Vegas – the share of homeowners with a mortgage that were underwater, owing more on their home than it was worth on the open market – was 71.4 percent. Much of this negative equity was concentrated in the bottom end of the market, and many of those homeowners were not only underwater, but very deeply so. Almost unbelievably, in early 2012, 27 percent of homeowners with a mortgage owed more than double what their house was worth, a number nowhere close to being matched in any other large market nationwide, even in other very hard-hit markets (figure 3).
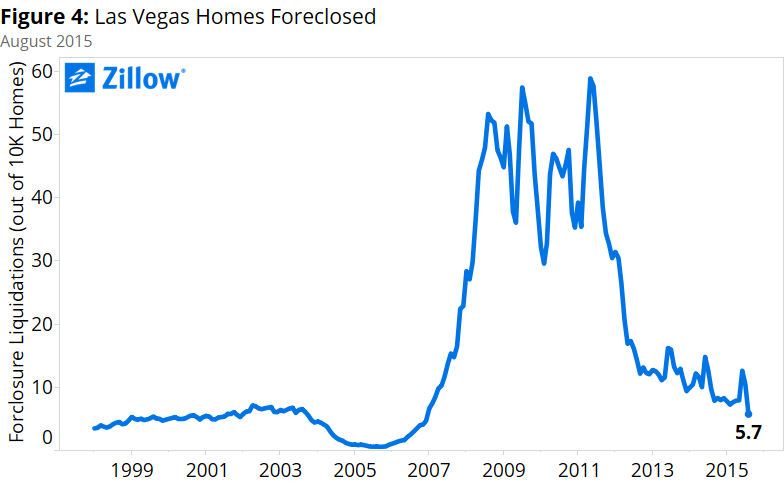
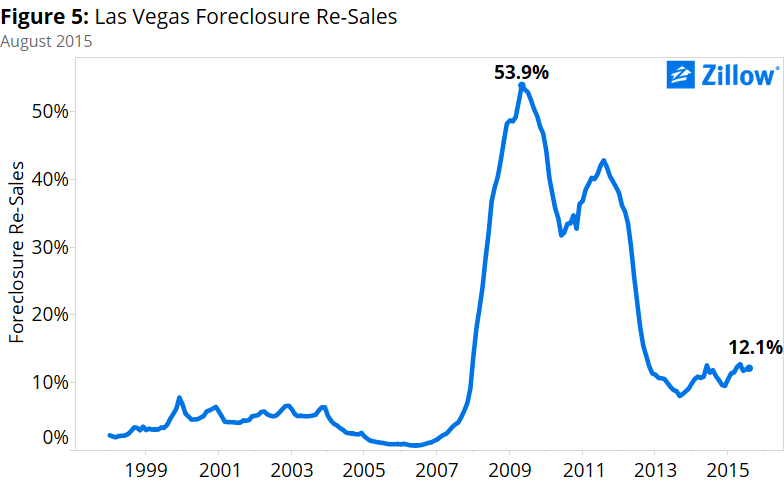
The high rate of negative equity in the Las Vegas area, in turn, was a major contributor to an unprecedented wave of foreclosures. At this wave’s height, 60 out of every 10,000 Las Vegas-area homes were foreclosed upon, 6 times the national rate (figure 4). And as these homes moved through the foreclosure pipeline and were eventually re-sold as REOs – typically at prices lower than market rates – they further depressed the market, driving overall home values down even more. In 2009, more than 60 percent of all sales in Las Vegas were distressed foreclosure re-sales (figure 5).
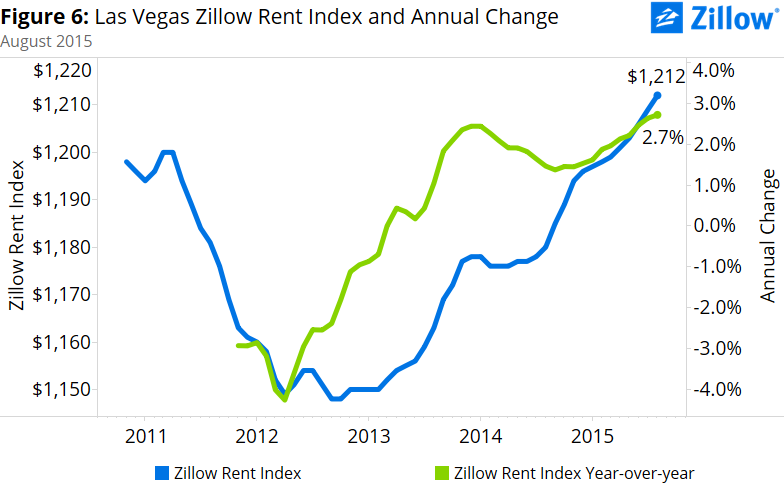
These thousands of foreclosed-upon former homeowners still needed to live somewhere, of course, and many turned to the rental market. This influx of rental demand also helped push up rents themselves, and the pace of growth in rents rapidly accelerated. As of March 2013, annual growth in the Zillow Rent Index in Las Vegas was flat. Less than a year later, by January 2014, rents were growing at an annual rate of 2.4 percent, and that growth rate remains high today. The Zillow Rent Index measuring the median rental payment in the Las Vegas metro was $1,212 per month in August, up 2.7 percent year-over-year (figure 6).
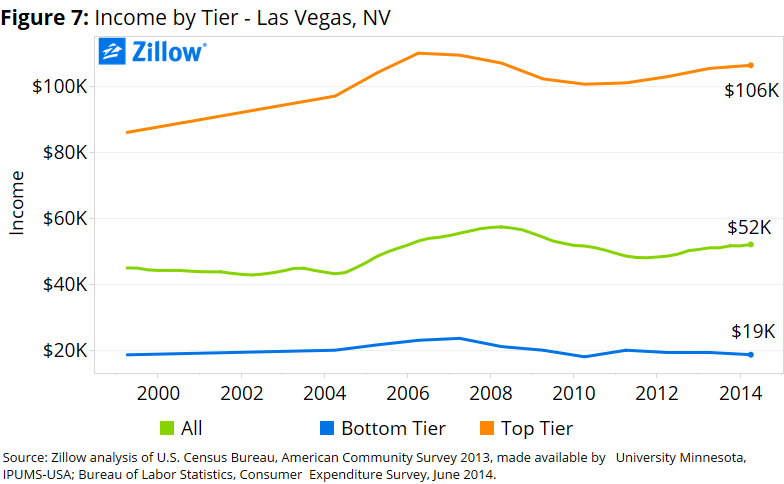 Rents have risen so far, so fast – especially compared to incomes – that Las Vegas, like much of the rest of the nation, is experiencing a growing rental affordability crisis. Currently, Las Vegas renters are spending 27 percent of their monthly income on a typical rental payment, up from 23 percent historically (the period from 1985 through the end of 1999). Much of this imbalance is driven by incomes that haven’t grown and have even fallen for some over the last 15 years, especially at the bottom end of the income distribution (figure 7).
Buying a home in Las Vegas, on the other hand, is very affordable. Currently, a homebuyer can expect to spend 16 percent of their monthly income on a mortgage payment, well below the 25 percent historic average. Unfortunately, it is not easy actually finding an affordable home for sale in Las Vegas, given how tight inventory has been (figure 8).
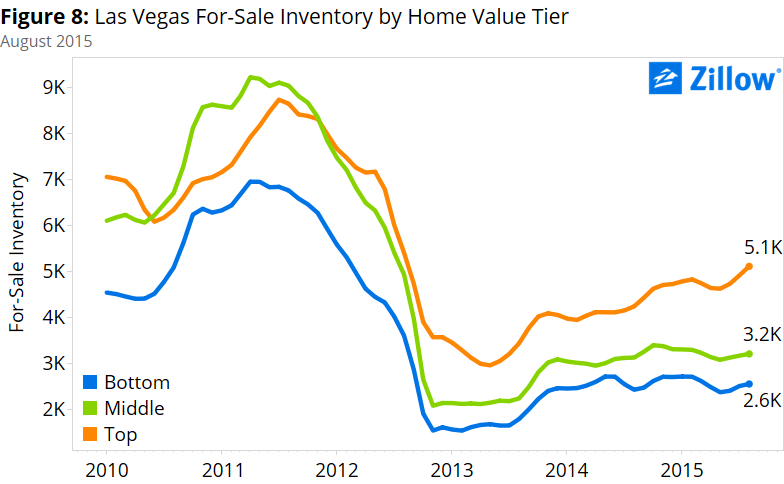 Some of this tightness has been driven by the still very high negative equity rate, which makes it very difficult for underwater homeowners to sell their home. Investors rapidly buying up largely lower-end homes to convert into rentals and capitalize on the hot rental market have also contributed to inventory tightness. Finally, subdued new construction activity – the reverse of the early 2000s building frenzy – has also helped keep overall inventory low, especially at the bottom end.
During the early stages of the recovery in Las Vegas, home values were growing at almost 30 percent per year, an incredibly fast rate that proved unsustainable. Annual home value growth has slowed to a current rate of about 7 percent – still very robust, but also much more sustainable.
Today, Las Vegas is undoubtedly in a much better spot than it was just a few short years ago. But many challenges remain, and we look forward to hearing more on October 14.
