No Construction: Why Yesterday’s Luxury Home Remains Today’s Luxury Home
Reversing a trend from prior decades, homes built when the housing bubble first started to inflate and through the height of the housing boom have held their value better than older, existing homes over the same period. But a lack of new construction in more recent years means those homes that were new a decade ago still remain “new” relative to other existing homes, and are not depreciating in value fast enough to replenish the quickly dwindling supply of livable, but older, more-affordable homes.
- The average U.S. home built in a given ZIP code in 2003 appreciated in value an average of 0.7 percent per year between 2003 and 2013, faster than the 0.5 percent annual appreciation rate of existing homes over the same period.
- Prior to the housing collapse, homes tended to fall an average of 1 percentage point in their ZIP code’s home value distribution per year. But a lack of new construction in the years following the crash has greatly slowed that process, and new homes built a decade ago are retaining much of their original value instead of depreciating into more affordable housing.
Reversing a trend from prior decades, homes built when the housing bubble first started to inflate and through the height of the housing boom have held their value better than older, existing homes over the same period. But a lack of new construction in more recent years means those homes that were new a decade ago still remain “new” relative to other existing homes, and are not depreciating in value fast enough to replenish the quickly dwindling supply of livable, but older, more-affordable homes.
As a result, inventory shortages and an already bad affordability situation at the bottom of the market are only getting worse.
The average U.S. home built in a given ZIP code in 2003 appreciated in value an average of 0.7 percent per year between 2003 and 2013 – not exactly a growth rate to brag about, but nevertheless faster than the typical existing home in the same ZIP code, which grew at only 0.5 percent annually (figure 1). This trend holds across most metros. But newly constructed homes haven’t always outperformed older, existing homes. So, what changed?
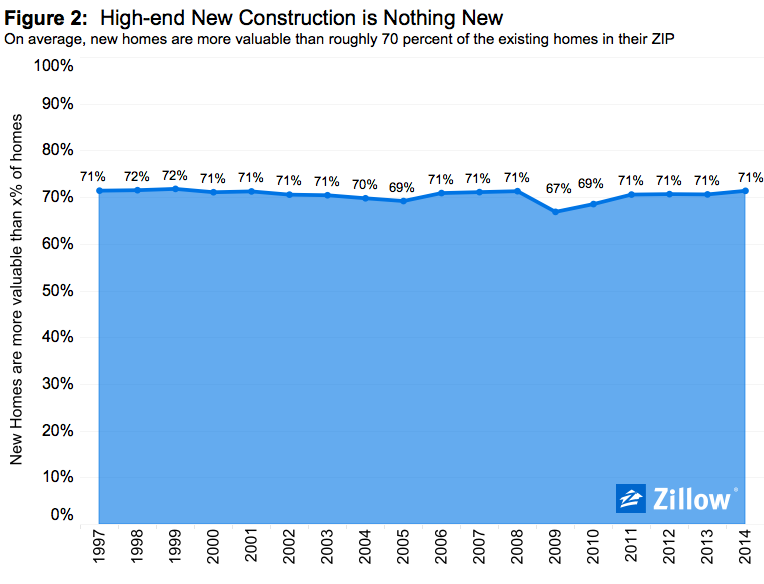 Typically, new construction is pricier than the existing housing stock. In every year since at least 1997,[1] the average newly built home was worth more than roughly 70 percent of other homes in its ZIP code when it was first built (figure 2). Or put another way – newly constructed homes tend to be priced in the 70th percentile of all homes in a given ZIP code. But just because new construction is generally aimed at a better-heeled clientele doesn’t mean its presence alone doesn’t impact the market as a whole. It does.
Because new construction enters the market at the upper end of the home value distribution, it has the effect of pushing the prices of other, older, existing homes down to more affordable levels – a phenomenon known in economic circles as the creation of naturally affordable housing. Or at least, that’s how it’s supposed to work. But when new construction dries up for extended periods, like it did in the wake of the housing collapse, there’s little pressure pushing the price of existing homes down to more affordable levels. Yesterday’s luxury homes remains today’s luxury homes, largely outside of the price range of many buyers – especially younger and first-time buyers of more limited means.
Prior to the housing collapse, homes tended to fall an average of 1 percentage point in their ZIP code’s home value distribution per year. For example, single-family homes built in 1997 were in the 71st percentile of home values in their given ZIP code; a decade later, as newer construction pushed them down the distribution, those homes had fallen into the 62nd percentile. Over time, we would expect these homes to keep falling down the value distribution and become the affordable housing of a couple decades from now.
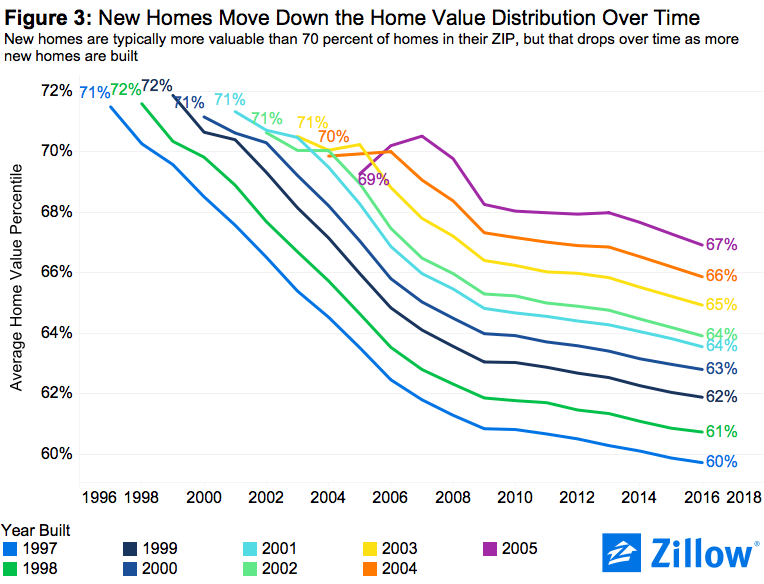 But this process slowed greatly as soon as the housing market collapsed and new construction froze up. Between 2009 and 2016, homes built in 1997 dropped only a single percentage point in the distribution, from the 61st percentile to the 60th (figure 3). We see this same pattern for every other vintage of homes as well.
Today, that leaves us with a situation in which homes that should have fallen to the bottom and middle segments of the housing market by now are instead still valuable enough to have upper-end buyers snatching them up. This constrains lower-end inventory, and leads to the affordability issues we see at the entry level of the market. So even though newly built homes are generally aimed at the high-end of the market, the overall need for new construction – and the ramifications of not building it – extends to all home buyers.
[1] As far back as historical Zestimate data goes.
