The Rental Market’s National Stability Hides Local Eccentricities (March 2024 Rental Market Report)
The rental landscape is experiencing subtle yet significant shifts. National rent growth remains stable, but a closer look shows notable differences between markets and rental types.
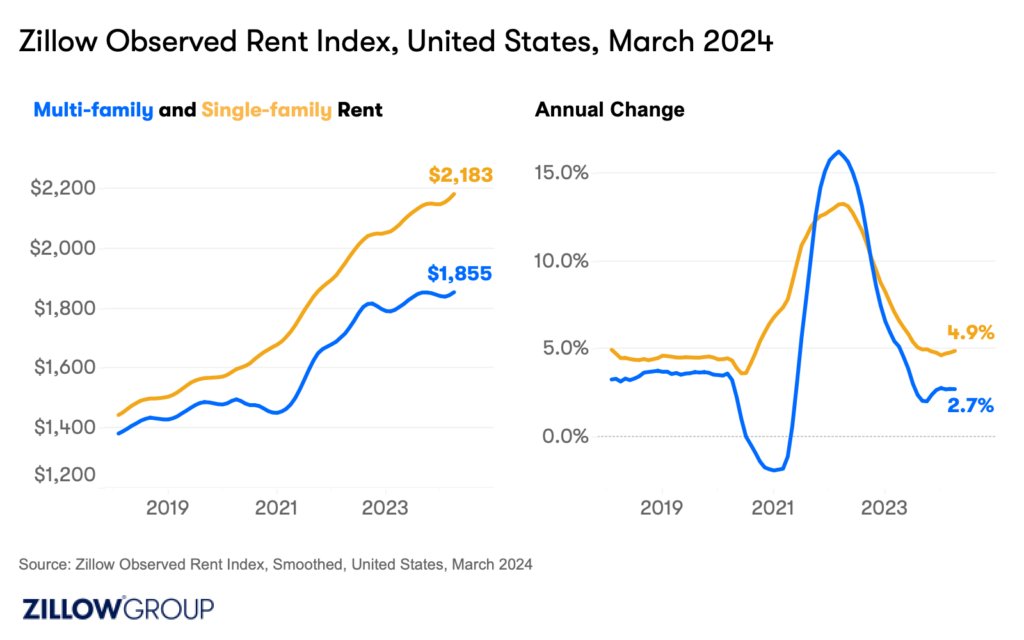
According to the Zillow Observed Rent Index, the typical U.S. rent rose 0.6% month-over-month in March to $1,983. This subtle climb was only slightly below the pre-pandemic seasonal average of 0.7%, continuing the “back to normal” trend. Rents are now 3.6% higher than a year ago.
March witnessed the typical rent for single-family homes rising 0.7% month-over-month to $2,183, a testament to their appeal for renters. This sector’s resilience, with a 37.5% increase since the pandemic’s onset, mirrors the aging of the eldest of the sizable millennial generation into their early 40s, and a broader trend towards demand for more spacious but sharable living among both renters and home buyers.
On the other hand, rents for multi-family units had a more modest growth rate, up 0.5% month-over-month, suggesting a diversifying market.
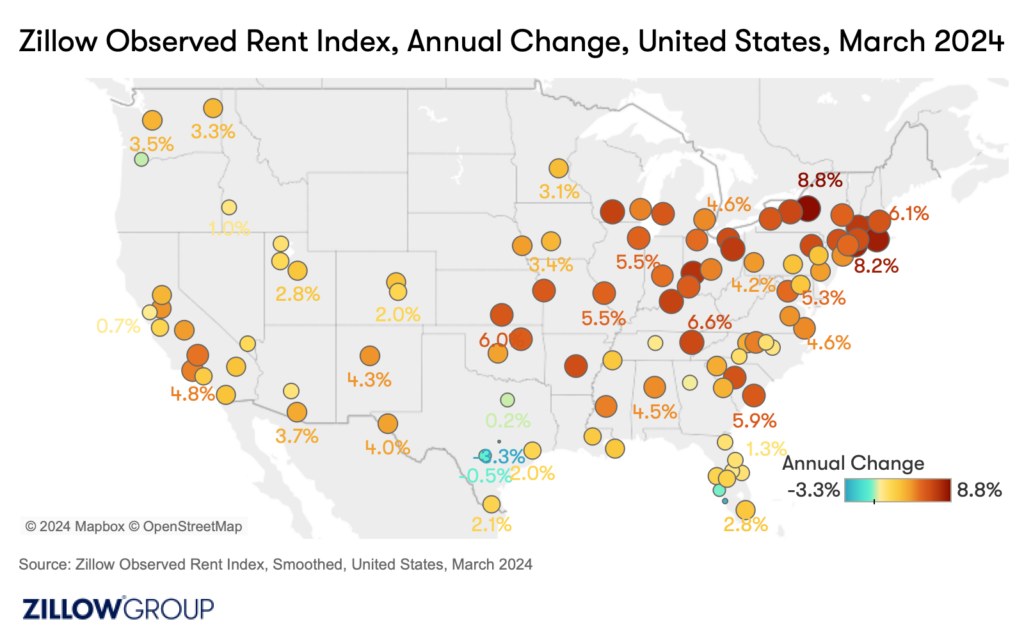
While overall trends point towards mild to modest growth, the story varies significantly at the metro level.
Among the 50 largest U.S. metro areas, Pittsburgh stood out as the sole area to see a decrease in typical rents (-0.2%) from February to March. In contrast, areas such as Washington D.C., the New York City metro area, and San Jose each recorded significant 1% increases in typical rents on a month-to-month basis.
Rent growth trends vary widely on an annual basis as well. Typical rents in Providence were 8.2% higher in March than a year ago, and in Louisville rents were up 6.9% year over year.
Annually, rents were up in 48 of the 50 metro areas analyzed. The two metros where rents are down from a year ago are in Texas: Austin (-3.3%) and San Antonio (-0.6%). This diversity highlights the uneven spread of record new construction over the course of the pandemic and the localized nature of market health.
As the market adapts, so too do the strategies of landlords and property managers. In March, 33% of Zillow’s rental listings advertised a concession like free months of rent or free parking. The 0.9 percentage point rise in concessions from February to March is a slight upswing since the rate of concessions stabilized late last year. The consistent use of strategic methods to attract renters, especially in regions with lots of choices due to the recent surge in new apartment construction, suggests continued softness in asking rents in the future. Some property managers may choose to offer a concession rather than fully drop the monthly asking rent price.
This uptick, especially notable in San Jose and Columbus — where the share of concessions rose 6.5 percentage points and 6.4 percentage points, respectively, and where asking rents in general are also increasing — underscores the importance of locality and adaptation in current rental strategies. Some property types may remain incredibly competitive, while others require incentives to lease up.
The nationwide rental vacancy rate was 6.6% as of Q4 2023, the most recent data available. For context, pre-pandemic, the average vacancy rate at this time of year was the same, housing permits were on the rise and experts were finally calling a full recovery from the Global Financial crisis of the aughts as far as housing was concerned.
However, today we are on the other side of an uneven surge in both renter mobility (2021 was a big year) and apartment construction. Both of which are driving significant regional fluctuations. These variations, from Baltimore’s notable vacancy rate drop (-4.9ppts) to Buffalo’s increase (6.8ppts), hint at the dynamic forces at play within local rental markets.
Rent affordability is another major force at play within the rental market. The typical asking rate rent in the U.S. reached 29.1% of median household income in March, closing in on a common rule of thumb to avoid spending more than a third of the household income on fixed expenses like rent. The necessary income to afford rent in the U.S. is now at $79,307, more than 6% higher than the typical household actually makes — a picture of the financial pressures facing renters today.
As we look forward, the rental market’s trajectory will undoubtedly be shaped by broader economic factors, including ongoing apartment building construction, and the evolving needs and preferences of renters in an uncertain general economy. Staying attuned to these shifts will be crucial for all market participants, from renters seeking their next home to landlords and property managers navigating the complexities of supply and demand.
