Uncategorized
Key Takeaways from the March New Home Sales Report
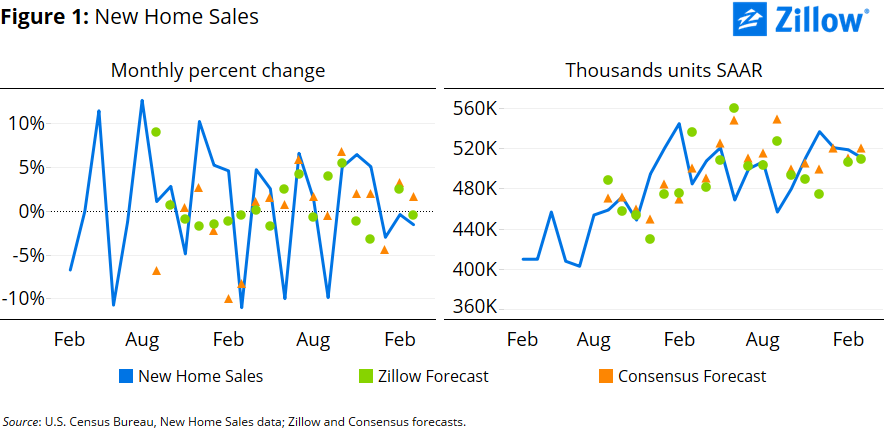
March new home sales fell 1.5 percent from February to 511,000 units (SAAR), according to the Census Bureau. Compared to a year earlier, March new home sales were up 5.4 percent, largely reversing the 4.8 percent decline recorded in February.
- March new home sales fell 1.5 percent from February to 511,000 units (SAAR), according to the Census Bureau. Compared to a year earlier, March new home sales were up 5.4 percent, largely reversing the 4.8 percent decline recorded in February.
- The inventory of new homes for sale reached a six-year high, up 19.8 percent from a year ago.
- The median price of new homes fell 3 percent in March from February and 1.8 percent over the year, to $285,400. March was the third month of the past four in which the median price of new homes sold declined on both a monthly and an annual basis.
New home sales fell in March in line with expectations, down 1.5 percent from February to 511,000 units at a seasonally adjusted annual rate (SAAR), according to the U.S. Census Bureau. Compared to a year earlier, new home sales were up 5.4 percent in March.
January and February new home sales were also revised upward. January new home sales, initially reported at 494,000, are now estimated at 521,000. February new home sales were revised from 512,000 units to 519,000 units (figure 1). Because of the large upward revision in January data, February’s initially reported 2 percent increase in new home sales now appears to have been a 0.4 percent decrease.
 Continuing the see-saw pattern of recent months, new home sales and existing home sales again moved in opposite directions in March – new home sales fell while existing home sales rose. New and existing home sales have moved in opposite directions in 9 of the past 13 months.
Regionally, new home sales have had the strongest start to 2016 in the South (up 15.4 percent year-over-year in March), and weakest in the West (down 20.7 percent compared to a year earlier). These two regions account for a large majority of new home sales nationwide (upward of 80 percent). Over the past six months, new home sales have trended downward in the West (albeit with some volatility), and steadily upward in the South.
In a promising trend for home buyers, for-sale inventory of new homes increased 3 percent from February and 19.8 percent from a year ago, to 242,000 units (SAAR). This is the highest inventory level since September 2009, but is still well below historic (1985-2000) monthly averages of 323,000 units (SAAR).
The median seasonally adjusted price of new homes sold in March fell 3.25 percent from February and 1.8 percent from a year ago, to $285,400, the lowest median new home price of since September 2014. After increasing steadily from 2010 through 2014, and then holding roughly flat around $300,000 for much of late 2014 and 2015, the median price of new homes sold has declined on both a monthly and an annual basis in three of the past four months.

