Uncategorized
Key Takeaways from the May Existing Home Sales Report
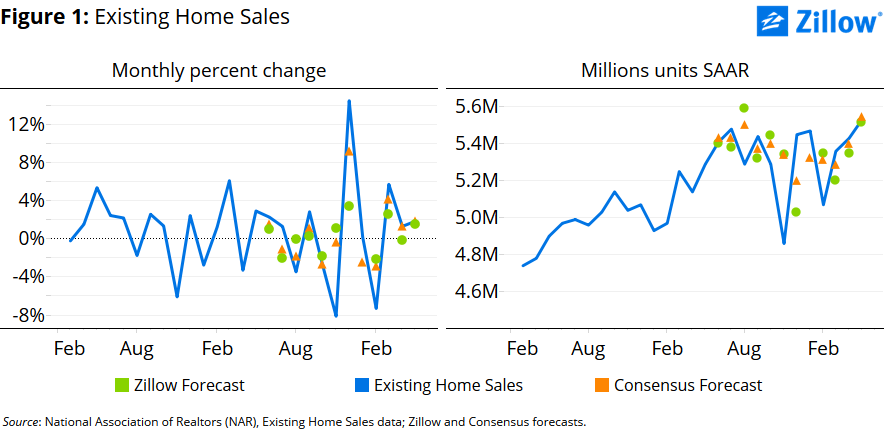
May existing home sales increased largely in line with expectations, up 1.8 percent from April to 5.53 million units at a seasonally-adjusted annual rate (SAAR), according to the National Association of Realtors.
- Existing home sales increased in May in line with expectations, rising 1.8 percent from April to 5.53 million units (SAAR), their third consecutive monthly increase.
- Inventory of homes for sale edged up 0.3 percent in May from April, but remains 5.75 percent below where it was a year ago. For-sale inventory of existing homes has now been contracting on an annual basis for 12 consecutive months.
- The median seasonally adjusted price of existing homes sold in May fell 0.6 percent from April, but held near all-time highs.
May existing home sales increased largely in line with expectations, up 1.8 percent from April to 5.53 million units at a seasonally-adjusted annual rate (SAAR), according to the National Association of Realtors.
April existing home sales were revised downward from 5.45 million units (SAAR) to 5.43 million units (SAAR), diminishing April’s initially reported 1.7 percent monthly gain in existing home sales to a revised 1.3 percent monthly gain (figure 1).
 Tight for-sale inventory continued to weigh on the housing market in May. While for-sale inventory edged up 0.3 percent from April, it remains 5.75 percent below its year-earlier level. The number of homes for sale has now fallen on an annual basis for 12 consecutive months, and has contracted year-over-year in 13 of the past 14 months. Over the past year, for-sale inventory has contracted at an average annual pace of 3.5 percent. Over the full history of the data series – which starts in January 1999 – inventories have increased at an average annual rate of 0.8 percent. Which is not to say periods of falling inventory are uncommon: Inventories have declined year-over-year in 90 of the 197 months (46 percent) since January 2000.
Still, the modest monthly increase in inventory wasn’t enough to compensate for strong demand among home buyers. The median number of days that existing homes sold spent on the market fell by almost a week from April, to just 32 days.
After touching a new all-time high in April at $231,300 – surpassing the pre-recession peak of $230,600 recorded in October 2005 – prices of existing homes sold in May retreated slightly. The median seasonally adjusted price of May existing home sales fell 0.6 percent from April, to $229,850, but is still up 4.7 percent over the year. The year-over-year percent change in price was the slowest annual growth rate recorded since July 2014, perhaps suggesting a slowdown in price gains.

