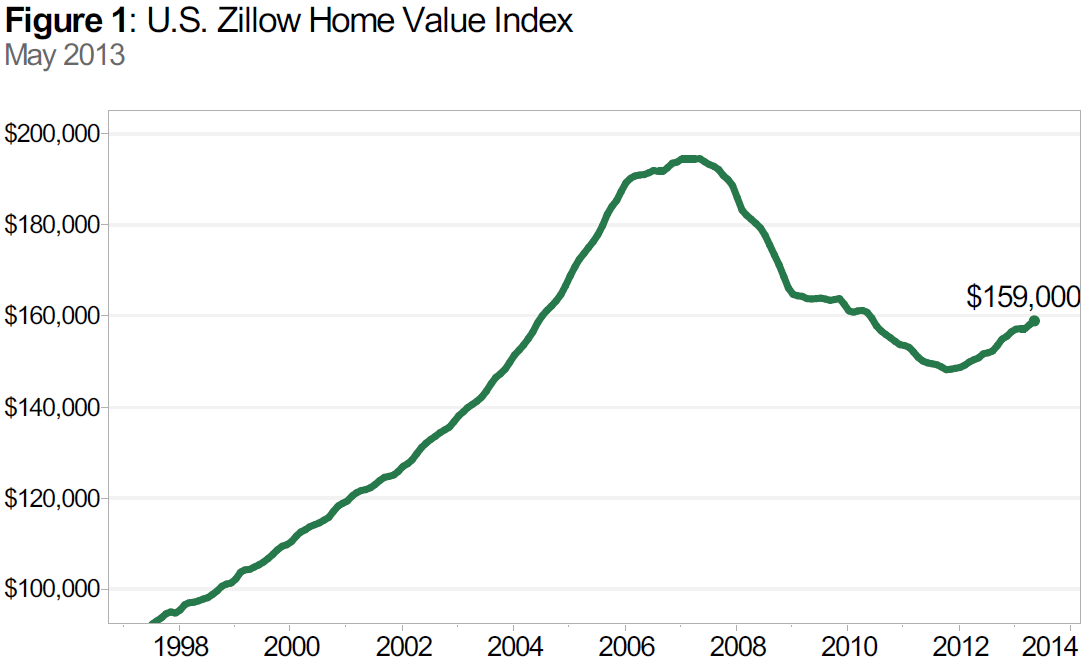
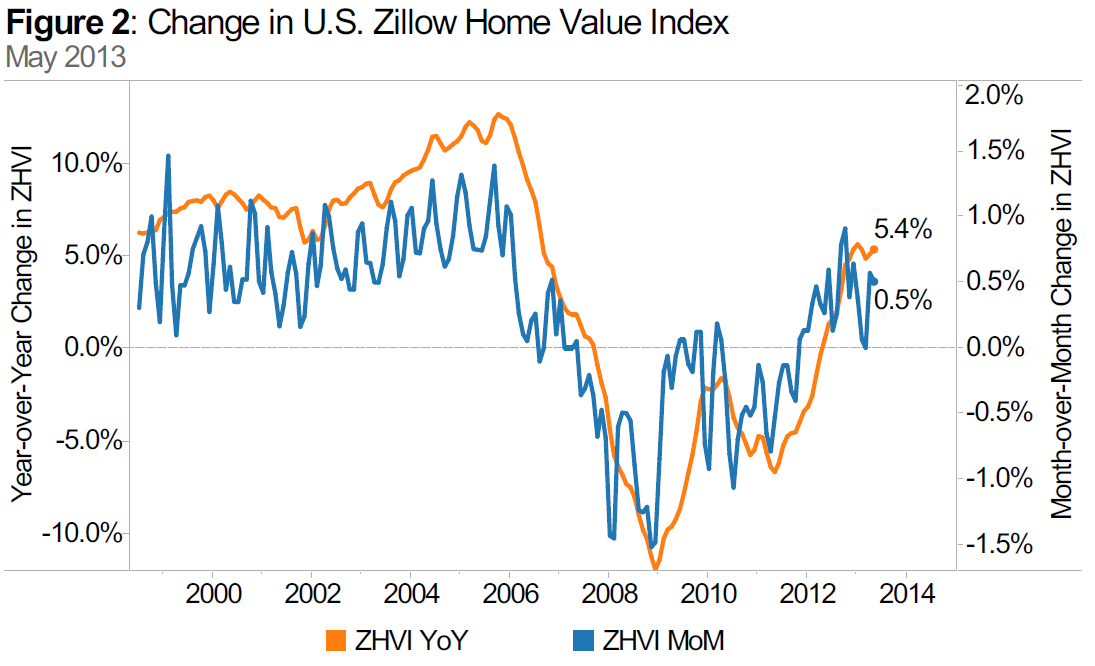
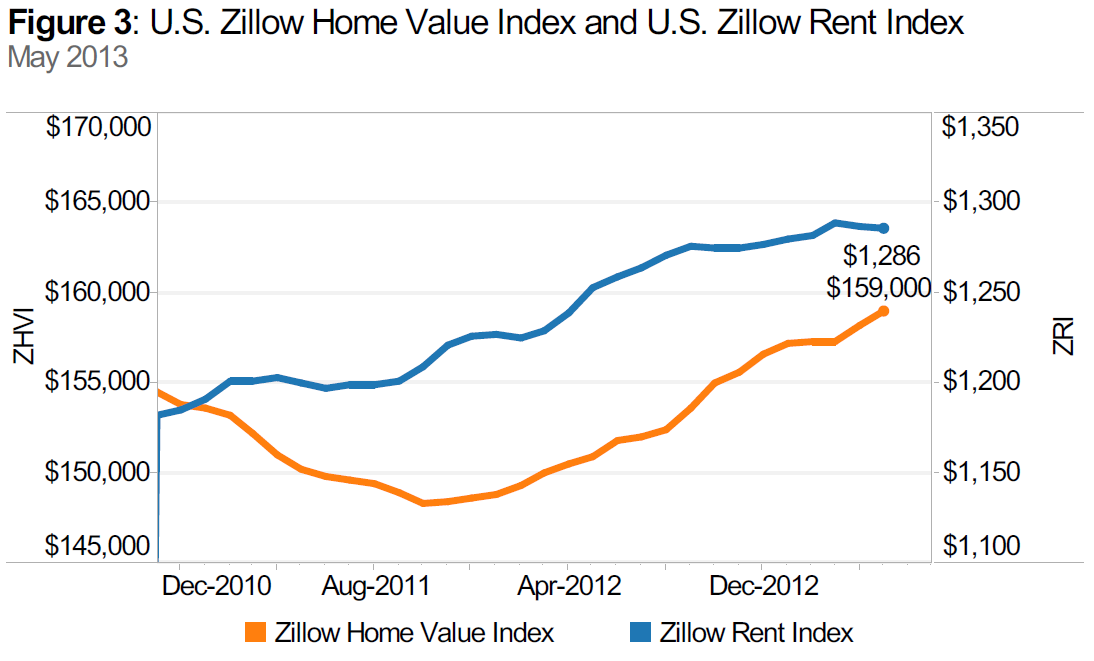
Zillow’s May Real Estate Market Reports, released today, show that national home values rose 0.5% from April to May to $159,000 (Figure 1). On a year-over-year basis, home values were up 5.4% (Figure 2) from May 2012. The last time national home values were at this level was in July 2004. Rents were up 2.6% on a year-over-year basis (Figure 3). The Zillow Home Value Forecast calls for 4.1% appreciation nationally from May 2013 to May 2014. Most markets have already hit a bottom – with only 8 out of 253 not projected to hit a bottom within the next year – and 63 out of the 253 markets covered are forecasted to experience home value appreciation of 4% or higher. Of the nation’s 30 largest metro areas covered by Zillow, 29 experienced year-over-year home value increases in May, with half up by double-digit percentages. Major markets where home values increased the most over the past year include Las Vegas (28%), Sacramento, Calif. (26.1%), San Francisco (24.2%), San Jose, Calif. (21.8%) and Phoenix (21.3%). St. Louis was the only metro area in the top 30 where home values declined year-over-year.
Home Values
The May Zillow Real Estate Market Reports cover 360 metropolitan and micropolitan areas. In May, 183 (51%) of the 360 markets showed monthly home value appreciation, and 258 (72%) of the 360 markets saw annual home value appreciation. Among the top 30 metros, 21 of them experienced monthly home value appreciation, and 29 of them experienced annual increases with only St. Louis (0.8% down) showing declining home values over the past year. Leading the pack in positive monthly appreciation were Sacramento, Las Vegas, Los Angeles and San Francisco, which experienced 1.7%, 1.3%, 1% and 1% monthly home value appreciation, respectively. Overall, national home values were down 18.3% from their peak in May 2007 and up 7.2% from the post-recession trough in October 2011.
Rents
The Zillow Rent Index (ZRI) covers 495 metropolitan and micropolitan areas and shows year-over-year gains for 321 metropolitan areas covered by the ZRI. As the for-sale market has started to pick up steam again, the rental market has seen decelerating appreciation. Currently national rents are up 2.6% on a year-over-year basis, which is a definite slow-down from 5 to 6% annual appreciation late last year (Figure 3). Large markets that saw extremely strong annual rent appreciation include Denver (7.6%), Cincinnati (6.2%), Boston (5%) and Portland (4.8%).
Foreclosures
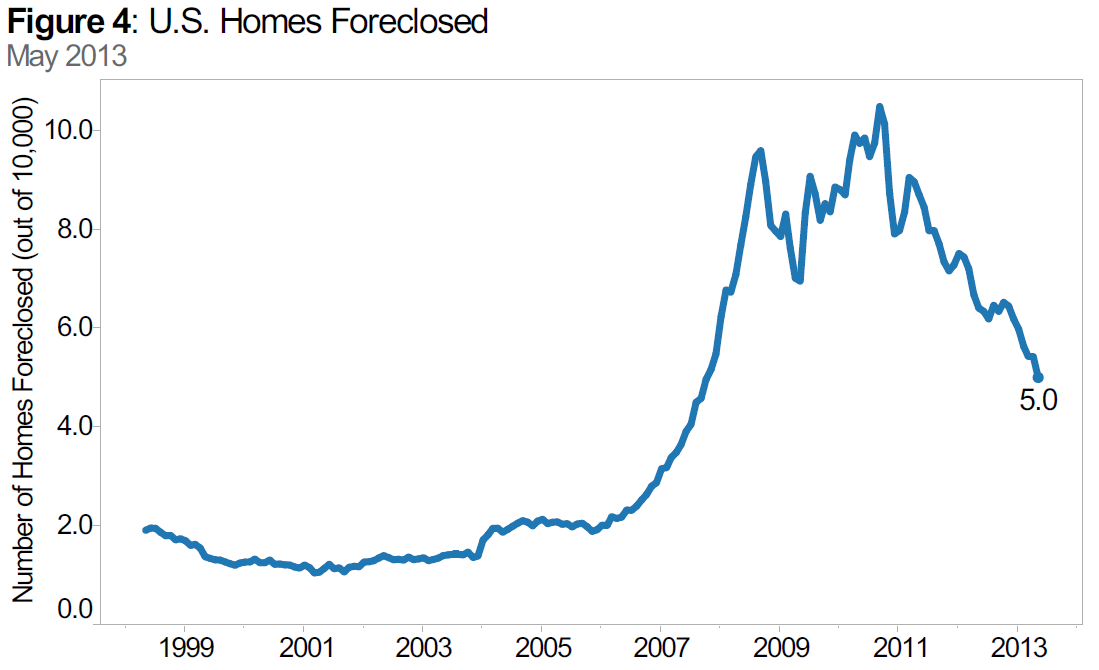
The rate of homes foreclosed continued to decline in May with 5.01 out of every 10,000 homes in the country being liquidated. The last time it was at this rate was in October 2007. Nationally, foreclosure resales also continued to fall, making up 10.66% of all sales in May (Figure 4). This is down 3.8 percentage points from May 2012 and down 9.2 percentage points from its peak level of 19.9% in March 2009.
Outlook
With increasing mortgage rates and rising home values we expect to see home value appreciation moderate by the end of the year and into the next, especially in regions where appreciation has been particularly strong. Some markets will have stronger appreciation for longer than others as investor activity and inventory constraints greatly vary across markets. We have started to see inventory constraints ease, though, as more for-sale properties have come on-line, relaxing home value appreciation a bit. In June, housing inventory was 12.2% tighter nationally than in June of last year.
The Zillow Home Value Forecast calls for 4.1% appreciation nationally from May 2013 to May 2014. Negative equity in the first quarter of 2013 stands at 25.4% nationally and is trending down as home values increase. Unfortunately, high levels of negative equity will remain with us for the next few years given the extent of home value declines in hard-hit markets such as Phoenix and Las Vegas.

