Demographics in Miami: Miami’s Face, America’s Future?

Miami has a well-deserved reputation for hospitality, welcoming tens of thousands of visitors and migrants attracted by the city’s legendary beauty and tolerance, and its promise of opportunity (not to mention having one of the largest cruise ports in the world).
As we look ahead at Miami’s opportunities and challenges during the fourth stop on our Housing Roadmap to 2016 tour of America to discuss issues like the changing demographics, foreign buyers, cash buyers, affordability and equality, it is essential to understand Miami’s recent history and its current situation. You have to understand where it came from to know where it will go.
In advance of our trip to Miami on August 27, we will be posting a series of research briefs focused on the challenges and opportunity unique to the area. All our Miami research can be found here.
For decades, Miami has stood at the leading edge of the major demographic forces now sweeping much of the United States – aging and immigration. The coastal city has long been the first home for newcomers to the United States, and the last home for greying Northerners seeking sand and sun in their twilight years.
But in many ways, these trends are one and the same. Miami continues to receive new immigrants, all while the city’s longstanding immigrant population is rapidly aging.
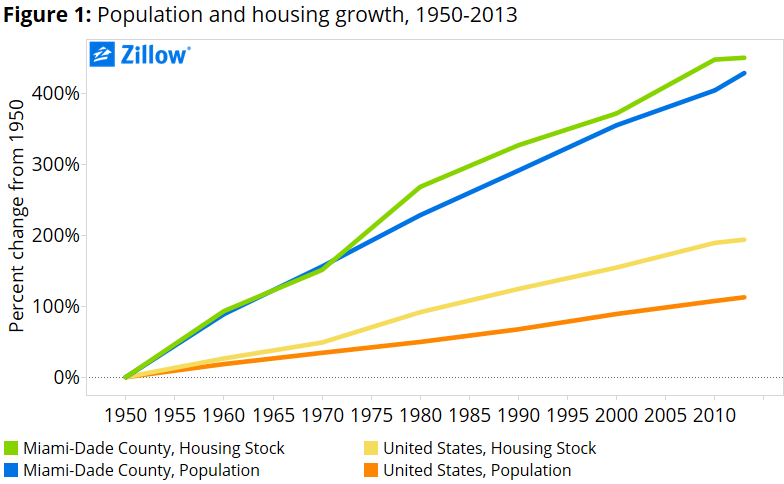
In 1950 Miami-Dade County was home to less than 500,000 residents.[1] Since then, the county’s population has more than quintupled to 2.6 million, more than twice the pace of growth of the United States as a whole over the same time (figure 1). Miami’s population and housing stock have grown roughly in line with each other. By contrast, the growth rate of housing units nationwide has outpaced population growth for much of the past four decades, driven in part by a trend toward smaller families.
The roughly balanced pace of growth in Miami stands in stark contrast to other parts of the country, like Detroit, where the population has declined at twice the pace of the housing stock.
No other demographic force has shaped Miami over the past half century more than immigration, particularly immigration from the Caribbean and South America.[1] More than half of Miamians (51 percent) were born abroad, and almost three-quarters (71 percent) of Miami households have at least one immigrant member.[2] In the United States as a whole, 13 percent of the population is foreign born and 18 percent of households have at least one member who is an immigrant.
The overwhelming majority of immigrants (93 percent) come to Miami from Latin America and the Caribbean, and these immigrants account for almost half (49 percent) of Miami’s total population. Spanish is the primary language spoken in 63 percent of Miami households, followed by English (29 percent), French (5 percent) and Portuguese (1 percent). The Cuban-born alone account for 49 percent of immigrants, and 26 percent of the total population. The number of Cubans in Miami far surpasses the next largest nationalities – Colombians, Haitians, and Nicaraguans (6 percent each) and Venezuelans, Hondurans, Peruvians and Dominicans (3 percent each).
Geographically, the foreign-born population is concentrated to the west and northwest of Downtown Miami (figure 2). There is great diversity in the foreign-born share of the population across Miami – ranging from 76 percent in ZIP code 33010 (adjacent to Miami International Airport and covering part of the city of Hialeah), to 21.4 percent in ZIP code 33056 in Miami Gardens. Immigrants are an outright majority of the population in 36 of Miami-Dade County’s 77 ZIP codes.
Cubans dominate most of these ZIP codes, but in some communities different groups are more numerous. In ZIP code 33178, covering the city of Doral, Venezuelans are the most populous immigrant group, while Haitians are the majority in a cluster of ZIP codes to the north of Downtown. Colombians are the most numerous group in the downtown urban core. In Miami Gardens, where there are far fewer immigrants overall, the most common immigrant group is from Jamaica.
The Cuban population – including individuals born in Cuba and individuals born in the United States of Cuban ancestry[3] – obviously overlaps substantially with the foreign-born population, but the differences are more exaggerated citywide (figure 3). In upscale Fisher Island (ZIP code 33109), essentially no individuals reported Cuban ancestry, while in ZIP code 33013 in Hialeah, 83 percent of the population reported Cuban ancestry. In ZIP code 33125, the core of historic Little Havana, only half of residents report Cuban origins.
South Florida is often perceived as a major destination for retirees, particularly those fleeing colder climates in New England and the Mid-Atlantic. But in reality, the snowbird phenomenon is more prominent farther north in the Miami metro, particularly Palm Beach County. In urban Miami-Dade County, 15 percent of the population is age 65 or older, only slightly above the national share (14 percent) and well below the share in Palm Beach County (22 percent). The elderly – those aged 80 or more – are twice as common in Palm Beach County (8 percent of the population) as they are in urban Miami-Dade County (4 percent of the population).
Still, Miami-Dade County has its own unique challenges with respect to aging. The median age of white and black residents in urban Miami-Dade County is 41 and 32, respectively, close to the median ages of whites and blacks nationwide (42 and 33, respectively). But the median age of Hispanics in urban Miami-Dade County is 40, compared to 28 among Hispanics nationwide. Hispanics represent 66 percent of the urban Miami-Dade County population overall, but 69 percent of the elderly population versus only 62 percent of the 17-and-under population.[4] Cubans are, on average, the oldest of Miami’s major Hispanic groups, with a median age of 44, followed by Peruvians (43), Colombians (38) and Venezuelans (36). Hondurans and Mexicans are the youngest, on average, with median ages of 31 and 25, respectively.
Given this, it is perhaps not surprising that the Miami-Dade ZIP codes with the greatest concentrations of older adults tend to be largely ethnic Cuban areas (figure 4). Almost one-in-five residents of historic Little Havana is 65 or older, and in the largely Cuban communities of Hialeah, slightly less than one-in-four residents is a senior citizen. Exceptions include the coastal communities of North Miami Beach, Bal Harbor, Surfside and Miami Beach, which have smaller Cuban populations but large communities of senior citizens.
Long an oasis for weather-weary New Englanders and conflict-weary exiles and expatriates from Latin America, Miami in many respects foreshadows the future of much of the United States – older and more diverse – albeit on an exaggerated scale.
Population growth has, above all else, driven Miami’s housing market over the past half century. And the preferences of these new arrivals inevitably shape housing demand – be it the preference of retirees for smaller, coastal living or the historic preference of recent immigrants to live in close-knit communities, often in multigenerational households with extended families under the same roof. More recently, the influx of a well-heeled, international jet set has created new demand for luxury units.[5] As in the nation, Miami’s shifting demographics have and will continue to leave an indelible footprint on the city’s housing stock.
[1] The data in this section are for Miami-Dade County (known as Dade County prior to 1997) and the United States as published in U.S. Census Bureau, “Population of States and Counties in the United States: 1790-1990”; U.S. Census Bureau, “United States Summary 2010: Population and Housing Unit Counts,” September 2012; and U.S. Census Bureau, American Community Survey, 2013.
[1] Unless otherwise indicated, references to “Miami” or “urban Miami-Dade County” refers to area covering Public Use Microdata Areas (PUMAs) that are within Miami-Dade County and within the Miami-Fort Lauderdale-West Palm Beach metropolitan area. Aggregate data are based on Zillow analysis of the U.S. Census Bureau, American Community Survey (ACS), 2013 made available by the University of Minnesota, IPUMS-USA. ZIP Code level data are from the five-year pooled 2009-2013 ACS as published by the U.S. Census Bureau.
[2] Includes only individuals born outside the United States without U.S. citizenship. It does not include individuals born outside the United States but who were U.S. citizens at birth – for instance, children born to U.S. military officers stationed overseas, or children born to American parents residing abroad.
[3] Based on the Hispanic origin field in the American Community Survey, which includes “Cuban” as a response option. Hispanics broadly account for 66 percent of Miami’s population, compared to 17 percent of the total U.S. population.
[4] Miami children are much more likely to identify as black – 20 percent of urban Miami-Dade residents under age 18 are black, compared to just 9 percent of urban Miami-Dade residents aged 80 or higher.
[5] As an illustration of this recent trend, in ZIP codes where Cubans are the most numerous foreign-born group, the median home value is $244,400; in ZIP codes where Colombians, who tend to be more recent arrivals, dominate, the median home value is $394,800. Similarly, in the ZIP code where Venezuelans, the vast majority of whom arrived in the past decade, dominate, the median home value is $321,000.
