Sales Up, Size Down for $1 Million Homes
The typical million-dollar home has shrunk in size across nearly all major metropolitan areas

The typical million-dollar home has shrunk in size across nearly all major metropolitan areas
The pandemic saw the hottest housing market in recent history, with annual home value growth surpassing 20% and for-sale inventory levels reaching historic lows. One result of these abnormally hot conditions is that homes are selling for more than $1 million much more often, while the typical million-dollar home looks a lot different than it did heading into the pandemic.
Single-family homes in the million-dollar range [1]| that sold in the second quarter of 2022 are noticeably different from homes that sold in the same price range in the years preceding the COVID-19 pandemic. Today’s million-dollar homes have undergone shrinkflation, possessing a much smaller footprint than the million-dollar homes of 2019. They also have fewer bathrooms and are older overall.
This effect is stronger in some metropolitan areas than others, like Phoenix, Austin, Los Angeles, and San Diego , where homes have had some of the largest drops in square footage and the number of bathrooms over the past three years. But in St. Louis and Minneapolis, the typical million-dollar home grew.
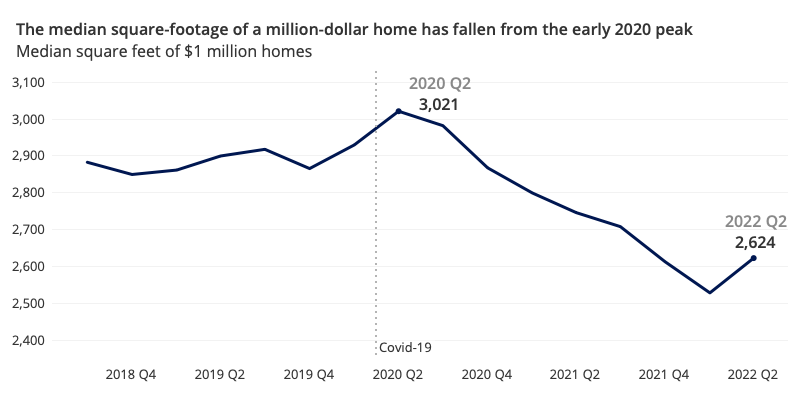
Persistent market competition, even for the highest-priced homes, meant that those shopping in this price range experienced shrinkflation, as the same $1 million bought less home. The median square footage of a million-dollar home in the second quarter of 2019 was 2,900 square feet, and this size was actually increasing leading into the pandemic. It has since plummeted, reaching new lows in 2022. As of the end of June, the median square footage of a million-dollar home sits at 2,624 square feet, a 9.5% decline from three years prior.
New listings for all homes have had a hard time keeping pace with past years during the pandemic and that continues to be the case – through June, 27.5% fewer listings have come on the market compared to the first half of 2019. Fewer homes have been listed for around $1 million, making the competition for these homes fiercer. The median square footage of those listings has shrunk as well, forcing many home shoppers in this price range to settle for homes with a smaller footprint.
The typical million-dollar home has shrunk across nearly all major metropolitan areas where data is available. While the decline was less than 300 square feet for the nation as a whole, other markets such as Phoenix saw the median size of its million-dollar homes drop more than 1,000 square feet, from 4,049 square feet in 2019 to 2,933 this past quarter. Nashville, which, like Phoenix, experienced an especially hot pandemic housing market, saw the typical million-dollar home drop from 4,200 square feet to 3,181. There were only two metros where the size of a million dollar home increased – Minneapolis and St. Louis. While the spatial gains in Minneapolis are minimal at only 36 square feet, St. Louis’ median million-dollar home gained 406 square feet, about a room and a half.
Bathrooms were the biggest casualty of this square footage loss. Only four of the observed metros saw the median million-dollar home maintain the same number of bathrooms compared to 2019. The rest lost at least the powder room. Denver and Minneapolis were the biggest losers, losing a bathroom and a half in their million-dollar homes.
Nationally, the typical million-dollar home purchased is also older today than it was in 2019, and much older in some markets. In St. Louis, the typical million-dollar home that sold in Q2 2022 was nearly 23 years older compared to 2019. Las Vegas and San Diego million-dollar homes aged 16 years over the same timeframe. In Austin, despite having a hot pandemic market, the typical million-dollar home actually got younger, from 22 years old in 2019 to 16 years this past quarter. This is potentially due to the high level of new construction homes that builders built during the pandemic to keep up with intense demand, bringing down the median age of homes in the area.
The youngest million-dollar homes are in Raleigh, where the homes were typically built only 15 years prior. Other Southern and Midwestern metros dominate the top of the list for youngest million-dollar homes, largely due to the space available for new construction to add this new inventory. To contrast, the oldest million-dollar homes are in the far denser markets of the Northeast and California, with Providence and New York having typical million dollar homes nearing the age of retirement.
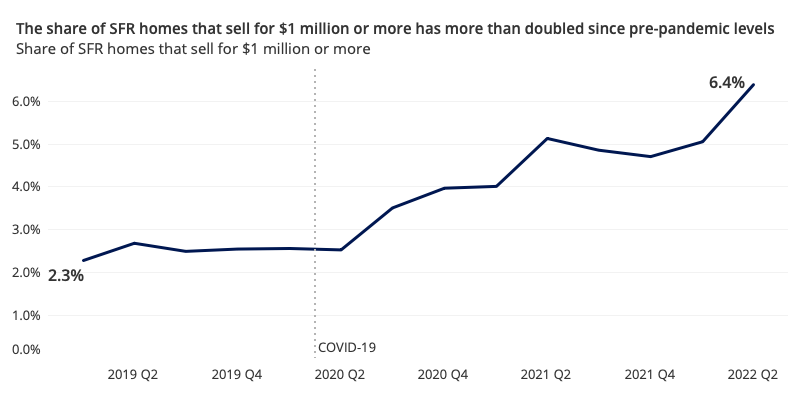
Overall home sales were elevated during the pandemic, but have slowed in recent months as the market begins to rebalance. This is because as prices and mortgage rates increased, housing affordability fell, pushing many potential home buyers to the sidelines. However, the volume of homes that sold for $1 million or more is still on the rise, having more than doubled since 2019 As a result, the share of single-family homes that sold for $1 million or more has increased from 2.7% in Q2 2019 to 6.4% in Q2 2022.
So if overall home sales have fallen, why haven’t home sales fallen in the $1 million or more range? First, higher home prices naturally means more homes, regardless of size, were pushed into the $1 million club. Second, those with means to buy a home for more than $1 million may be less sensitive to rising prices.
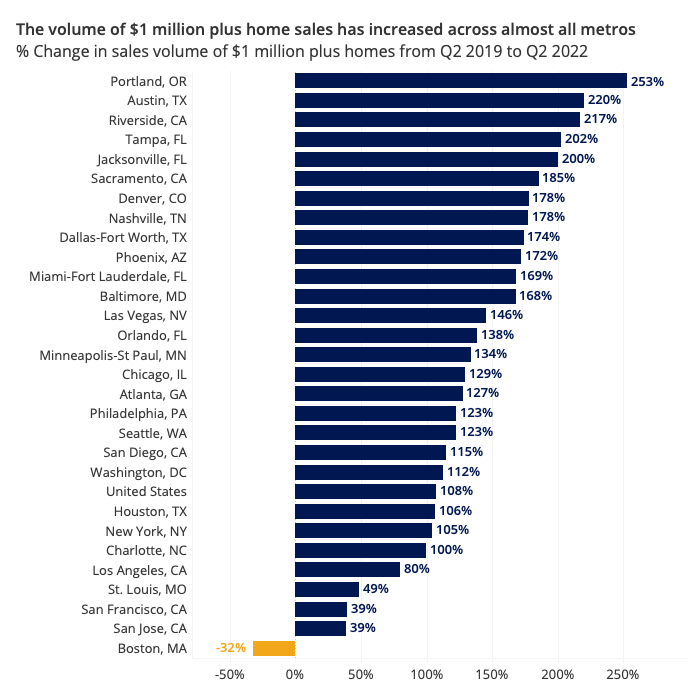
Some of the markets that experienced the fastest home value growth during the pandemic saw the volume of $1 million or more home sales more than double. In Austin, where home values were up 18.3% year-over-year as of July, the number of $1 million or more home sales increased by 220% from Q2 2019 to Q2 2022. Tampa is another hot market and $1 million or more sales similarly tripled in that time. In fact, the only metro that saw a decline in the share of transactions with a $1 million or more price tag was Boston, where the share declined by 32%. Boston was also a market that saw lower home value growth compared to other markets during the peaks of appreciation over the past two years.
What do million-dollar homes look like across the nation’s biggest markets? Regardless of where you live, you can be confident that your $1 million will get you at least three bedrooms, two bathrooms, and just shy of 1,400 square feet. That floor is set in San Jose where the typical million-dollar home had the above characteristics, amounting to a whopping $715 per square foot. For context, a typical home in San Jose was approaching $1.8 million for single-family homes in June, so a mere $1 million home is a great deal less expensive.
On the other end of the scale is Hartford, where the typical million-dollar home had four bedrooms, about four bathrooms, and boasted a spacious 4,873 square feet. That is more than triple the size of a million-dollar home in San Jose, and amounts to $205 per square foot. Indianapolis provides spacious accommodations for those with means as well. The typical million-dollar home there features five bedrooms and 4.5 bathrooms. While slightly smaller than the million-dollar homes in Hartford, 4,788 square feet is still plenty of room compared to much of the country.
| Metro | Median Age | Bathrooms | Bedrooms | Median Sq. Ft. | Number of $1M Plus Sales | ZHVI |
| Atlanta, GA | 24 | 4.5 | 5 | 4,130 | 1,426 | $385,510 |
| Austin, TX | 16 | 3 | 4 | 2,930 | 1,228 | $599,196 |
| Baltimore, MD | 23 | 4 | 4 | 3,550 | 517 | $383,987 |
| Boston, MA | 39 | 2.5 | 4 | 2,745 | 948 | $690,721 |
| Charlotte, NC | 19 | 3.5 | 4 | 3,790 | 697 | $390,812 |
| Chicago, IL | 27 | 3.5 | 4 | 3,375 | 1,586 | $319,284 |
| Cincinnati, OH | 27 | 4.5 | 4 | 4,514 | 103 | $269,030 |
| Columbus, OH | 22 | 4 | 4 | 3,467 | 97 | $313,487 |
| Dallas-Fort Worth, TX | 16 | 4 | 4 | 3,818 | 1,767 | $399,198 |
| Denver, CO | 28 | 2.5 | 4 | 3,083 | 1,944 | $666,996 |
| Detroit, MI | 25 | 4 | 4 | 3,700 | 249 | $241,982 |
| Hartford, CT | 23 | 4.25 | 4 | 4,873 | 76 | $343,367 |
| Houston, TX | 18 | 3.5 | 4 | 3,831 | 1,215 | $314,000 |
| Indianapolis, IN | 18 | 4.5 | 5 | 4,788 | 149 | $273,346 |
| Jacksonville, FL | 19 | 3.5 | 4 | 2,898 | 447 | $376,400 |
| Kansas City, MO | 16 | 4.5 | 5 | 4,529 | 230 | $288,415 |
| Las Vegas, NV | 19 | 3 | 4 | 3,339 | 543 | $470,251 |
| Los Angeles-Long Beach-Anaheim, CA | 59 | 2 | 3 | 1,644 | 11,267 | $983,708 |
| Miami-Fort Lauderdale, FL | 33 | 3 | 4 | 2,617 | 3,222 | $531,575 |
| Minneapolis-St Paul, MN | 25.5 | 2.5 | 4 | 3,797 | 577 | $384,855 |
| Nashville, TN | 17 | 3.5 | 4 | 3,181 | 1,219 | $457,477 |
| New York, NY | 60 | 3 | 4 | 2,500 | 4,862 | $623,403 |
| Oklahoma City, OK | 17.5 | 4.5 | 4.5 | 4,677 | 110 | $217,740 |
| Orlando, FL | 17 | 4 | 5 | 3,671 | 527 | $409,911 |
| Philadelphia, PA | 26 | 3.5 | 4 | 3,510 | 788 | $341,182 |
| Phoenix, AZ | 23 | 3 | 4 | 2,933 | 2,191 | $489,518 |
| Portland, OR | 27 | 3 | 4 | 2,886 | 960 | $598,502 |
| Providence, RI | 62 | 2.5 | 4 | 2,944 | 217 | $460,123 |
| Raleigh, NC | 15 | 4 | 4 | 3,772 | 376 | $464,323 |
| Richmond, VA | 37 | 3 | 4 | 2,967 | 296 | $332,470 |
| Riverside, CA | 23 | 3 | 4 | 2,820 | 1,417 | $594,380 |
| Sacramento, CA | 27 | 3 | 4 | 2,641 | 976 | $624,938 |
| Salt Lake City, UT | 37 | 2.5 | 5 | 3,561 | 327 | $634,362 |
| San Antonio, TX | 16.5 | 3.5 | 4 | 3,830 | 259 | $339,578 |
| San Diego, CA | 43 | 2.5 | 3 | 1,835 | 3,162 | $971,947 |
| San Francisco, CA | 54 | 2 | 3 | 1,636 | 8,634 | $1,552,180 |
| San Jose, CA | 49 | 2 | 3 | 1,399 | 3,588 | $1,769,490 |
| Seattle, WA | 36 | 2 | 3 | 2,160 | 4,850 | $823,473 |
| St. Louis, MO | 50 | 3.5 | 4 | 4,108 | 195 | $247,784 |
| Tampa, FL | 30.5 | 3 | 4 | 2,690 | 783 | $395,925 |
| United States | 31 | 3 | 4 | 2,624 | 90,110 | $353,949 |
| Virginia Beach, VA | 21 | 4 | 4 | 3,500 | 159 | $331,766 |
| Washington, DC | 35 | 3.5 | 4 | 2,572 | 3,829 | $583,464 |
The change in million-dollar home sales from pre-pandemic to Q2 2022 show that even wealthy home buyers have not been immune to the effects of a hot housing market, as they have lost space and are paying for older homes than they did three years ago. However, recent Zillow research indicates that home sales in the most expensive third of the market may be slowing down faster while demand for homes in the least-expensive tiers stays strong, perhaps making it a better time for those with means to buy. Buyers who have regained some negotiating power may find it easier to strike a deal for a larger home that has that extra powder room heading into the third quarter.
[1] Homes that sold in the range of $950,000 to $1,050,000
Methodology
Million-dollar homes are defined as single-family homes that sold between $950,000 and $1,050,000. Condominiums are excluded to better control for composition of homes across markets. $1 million or more homes are defined as single-family homes that sold for at least $1,000,000.
Additionally, metropolitan areas that had fewer than 30 million-dollar home sales in a quarter are excluded from the analysis, due to limited observations to draw trends from.
