Across 29 Metro Areas, Residents Largely Support Allowing Missing Middle Homes in Residential Neighborhoods
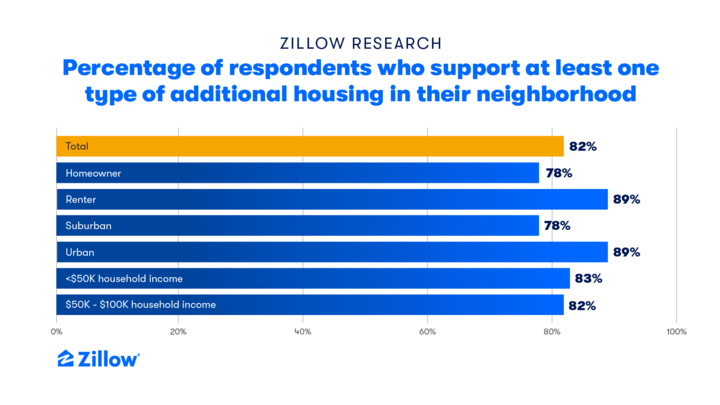
There is broad support to allow accessory dwelling units, duplexes and triplexes in residential neighborhoods, according to a new Zillow survey covering 29 U.S. metro areas, many of which are struggling with housing affordability. Most adults (82%) voiced support for allowing at least one multifamily option in their neighborhood. Among homeowners, 78% reported support for at least one, and support was higher among renters (89%).
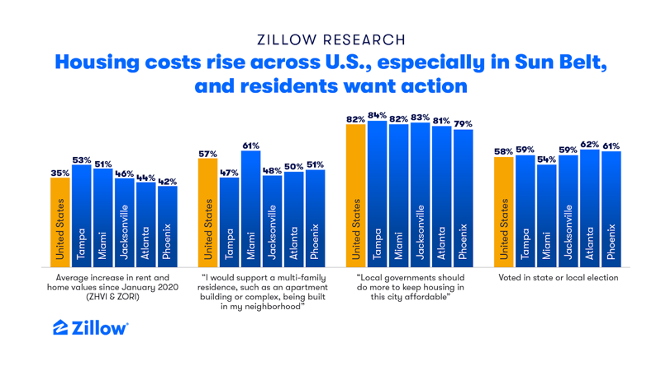
Rapidly rising rents and home values have pushed housing affordability to the center of the conversation in much of the country. Record-low inventory, triggered by a lost decade of home construction that caused a shortfall of 1.35 million new homes in 35 metro areas alone, has met a massive wave of demand, fueling an ultracompetitive market and pushing housing costs to crisis levels in some markets. There is no easy fix, but building more homes is likely the most effective tool to rein in price growth. Zillow research has shown that modest densification measures — allowing two units on 10% of single-family lots across some of the largest U.S. metros — could help boost critically needed housing supply enough to meaningfully slow housing price growth. This latest survey shows a growing consensus among homeowners and renters that similar measures should be taken in their own neighborhoods to address affordability.
Across the 29 metro areas Zillow surveyed, residents were more likely to support allowing accessory dwelling units (70% supported versus 23% opposed) and duplexes and triplexes (59% supported versus 34% opposed) in their neighborhoods.
About half of those who opposed allowing at least one type of multifamily home said that they would be more supportive under certain conditions – like requiring that newly built multi-family homes be within a 15-minute walk of parks and recreation (54%), a 15-minute walk of frequent transit service (54%), or requiring that at least 10% be affordable to low and middle-income families (51%).
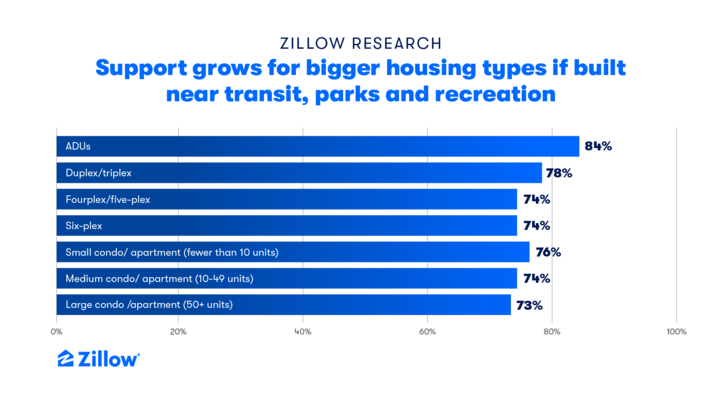
While fourplexes, fiveplexes, sixplexes and medium/large buildings generally did not garner majority support outright, respondents reported being more supportive of allowing new multifamily homes within a 15-minute walk of frequent transit, recreation, or with an affordability requirement for low and middle income families. For example, only 38% said they would support allowing large condo or apartment buildings in their neighborhood, but that number grew to 76% when including those that said they would be more supportive on a 15-minute or affordability condition.
Share of adults that say they would support allowing each home in their neighborhood OR who say that at least one multifamily condition (affordability, proximity to transit/recreation) would make them more supportive
| ADUs | Du/triplex | Four/fiveplex | Sixplex | Small condo/apartment (fewer than 10 units) | Medium condo/apartment (10-49 units) | Large condo/apartment (50+ units) | |
| Total | 85% | 80% | 77% | 77% | 79% | 77% | 76% |
| Atlanta | 83% | 73% | 72% | 72% | 74% | 72% | 72% |
| Baltimore | 80% | 74% | 72% | 70% | 72% | 73% | 71% |
| Boston | 87% | 84% | 80% | 80% | 81% | 80% | 80% |
| Chicago | 82% | 79% | 75% | 76% | 77% | 76% | 73% |
| Cincinnati | 82% | 75% | 71% | 71% | 73% | 72% | 73% |
| Dallas | 83% | 74% | 72% | 71% | 73% | 73% | 72% |
| Denver | 83% | 78% | 75% | 75% | 76% | 75% | 75% |
| Detroit | 82% | 74% | 72% | 72% | 75% | 74% | 73% |
| Houston | 83% | 78% | 73% | 74% | 74% | 72% | 72% |
| Jacksonville | 84% | 71% | 70% | 69% | 70% | 69% | 69% |
| Las Vegas | 86% | 76% | 75% | 74% | 75% | 75% | 74% |
| Los Angeles | 89% | 87% | 85% | 85% | 85% | 84% | 83% |
| Miami | 86% | 82% | 82% | 81% | 83% | 82% | 81% |
| Minneapolis | 86% | 79% | 75% | 74% | 76% | 75% | 74% |
| Nashville | 82% | 73% | 68% | 68% | 70% | 69% | 68% |
| New York | 84% | 81% | 79% | 78% | 80% | 80% | 78% |
| Philadelphia | 85% | 79% | 74% | 74% | 77% | 74% | 74% |
| Phoenix | 85% | 75% | 72% | 72% | 76% | 74% | 73% |
| Raleigh | 85% | 77% | 76% | 75% | 76% | 76% | 75% |
| Riverside | 87% | 82% | 82% | 80% | 81% | 80% | 80% |
| Sacramento | 80% | 72% | 71% | 69% | 70% | 70% | 69% |
| San Diego | 84% | 79% | 74% | 74% | 77% | 76% | 73% |
| San Francisco | 90% | 86% | 82% | 82% | 84% | 84% | 83% |
| San Jose | 91% | 81% | 78% | 78% | 79% | 77% | 78% |
| Seattle | 89% | 85% | 84% | 82% | 85% | 84% | 82% |
| Spokane | 88% | 78% | 75% | 75% | 75% | 74% | 74% |
| St. Louis | 82% | 75% | 69% | 69% | 71% | 70% | 69% |
| Tampa | 86% | 78% | 75% | 74% | 76% | 74% | 73% |
| Washington DC | 86% | 81% | 79% | 79% | 80% | 79% | 79% |
| ADUs | Du/triplex | Four/fiveplex | Sixplex | Small condo/apartment (fewer than 10 units) | Medium condo/apartment (10-49 units) | Large condo/apartment (50+ units) | |
| Total | 85% | 80% | 77% | 77% | 79% | 77% | 76% |
| Homeowner | 82% | 75% | 72% | 72% | 73% | 72% | 71% |
| Renter | 90% | 89% | 87% | 86% | 88% | 87% | 86% |
| Suburban | 82% | 75% | 72% | 72% | 74% | 72% | 71% |
| Urban | 90% | 89% | 87% | 87% | 87% | 87% | 86% |
| Gen Z (Ages 18 – 28) | 93% | 90% | 89% | 90% | 89% | 89% | 88% |
| Millennial (Ages 29 – 43) | 92% | 89% | 87% | 87% | 88% | 87% | 86% |
| Generation X (Ages 44 – 58) | 85% | 79% | 75% | 74% | 76% | 75% | 75% |
| Boomers + Silent Gen (59+) | 75% | 67% | 64% | 64% | 66% | 64% | 63% |
| Ages 18-29 | 93% | 90% | 89% | 89% | 90% | 90% | 88% |
| Ages 30-39 | 91% | 89% | 87% | 87% | 87% | 86% | 86% |
| Ages 40-49 | 89% | 84% | 81% | 79% | 82% | 82% | 81% |
| Ages 50-59 | 82% | 74% | 71% | 71% | 72% | 72% | 71% |
| Age 60+ | 74% | 66% | 63% | 62% | 65% | 63% | 62% |
| White | 82% | 75% | 72% | 71% | 73% | 72% | 71% |
| Black | 89% | 86% | 84% | 84% | 85% | 84% | 83% |
| Latinx | 88% | 86% | 84% | 84% | 85% | 84% | 83% |
| AAPI | 87% | 82% | 80% | 80% | 82% | 80% | 80% |
| Other race | 83% | 78% | 77% | 75% | 77% | 76% | 75% |
| Non-White | 87% | 84% | 82% | 82% | 83% | 83% | 82% |
| Cisgender Heterosexual | 84% | 79% | 76% | 76% | 77% | 76% | 75% |
| LGBTQ+ | 90% | 88% | 87% | 87% | 88% | 87% | 87% |
| <$50K HH Income | 85% | 83% | 81% | 81% | 82% | 81% | 80% |
| $50K-<$100K HH Income | 85% | 80% | 77% | 77% | 79% | 78% | 77% |
| $100K+ HH Income | 85% | 78% | 75% | 75% | 77% | 76% | 75% |
| Not registered to vote | 80% | 77% | 75% | 75% | 76% | 75% | 74% |
| Registered to vote at current address | 84% | 78% | 76% | 75% | 77% | 76% | 75% |
| Registered to vote before, but has not updated registration since moving | 92% | 91% | 88% | 89% | 88% | 89% | 88% |
| Voted in Presidential election | 84% | 78% | 75% | 75% | 77% | 76% | 75% |
| Did not vote in most recent presidential election | 87% | 83% | 82% | 82% | 82% | 82% | 81% |
| Voted in congressional election (federal house and/or senate) | 83% | 76% | 72% | 72% | 74% | 73% | 72% |
| Did not vote in most recent congressional election | 87% | 84% | 82% | 82% | 83% | 82% | 81% |
| Voted in state government (state legislature, governor) election | 83% | 76% | 73% | 73% | 75% | 74% | 73% |
| Did not vote in most recent state government election | 87% | 84% | 82% | 82% | 82% | 82% | 81% |
| Voted in local government (city and/or county council, school board) election | 83% | 76% | 72% | 72% | 74% | 73% | 71% |
| Did not vote in most recent local government election | 87% | 83% | 82% | 81% | 82% | 82% | 81% |
| Employed | 89% | 84% | 82% | 81% | 83% | 82% | 81% |
| Not Employed | 76% | 70% | 66% | 66% | 68% | 66% | 66% |
Share of adults that say they would support allowing each type of home in their neighborhood (without condition)
| Support at least one | ADUs | Du/ triplex | Four/ fiveplex | Sixplex | Small condo/ apartment (fewer than 10 units) | Medium condo/ apartment (10-49 units) | Large condo/ apartment (50+ units) | |
| Total | 82% | 70% | 59% | 45% | 40% | 52% | 45% | 38% |
| Atlanta | 77% | 68% | 48% | 36% | 34% | 47% | 42% | 36% |
| Baltimore | 77% | 64% | 48% | 32% | 25% | 39% | 36% | 26% |
| Boston | 82% | 68% | 61% | 43% | 37% | 52% | 44% | 36% |
| Chicago | 79% | 66% | 58% | 44% | 45% | 52% | 45% | 39% |
| Cincinnati | 79% | 65% | 49% | 34% | 26% | 45% | 38% | 34% |
| Dallas | 82% | 71% | 58% | 44% | 38% | 46% | 43% | 38% |
| Denver | 80% | 69% | 58% | 43% | 42% | 49% | 42% | 36% |
| Detroit | 80% | 65% | 51% | 32% | 27% | 48% | 42% | 36% |
| Houston | 81% | 69% | 54% | 43% | 36% | 52% | 44% | 35% |
| Jacksonville | 79% | 72% | 45% | 31% | 27% | 38% | 34% | 29% |
| Las Vegas | 81% | 69% | 51% | 39% | 38% | 50% | 44% | 37% |
| Los Angeles | 88% | 81% | 73% | 59% | 54% | 64% | 55% | 48% |
| Miami | 84% | 65% | 60% | 49% | 40% | 59% | 50% | 46% |
| Minneapolis | 84% | 76% | 61% | 44% | 38% | 51% | 40% | 34% |
| Nashville | 76% | 68% | 47% | 30% | 26% | 38% | 32% | 24% |
| New York | 82% | 66% | 62% | 48% | 42% | 53% | 50% | 42% |
| Philadelphia | 81% | 70% | 57% | 41% | 34% | 48% | 38% | 32% |
| Phoenix | 81% | 71% | 53% | 39% | 33% | 47% | 39% | 33% |
| Raleigh | 81% | 67% | 48% | 33% | 25% | 40% | 34% | 24% |
| Riverside | 85% | 73% | 60% | 42% | 35% | 53% | 45% | 38% |
| Sacramento | 79% | 70% | 55% | 42% | 33% | 43% | 35% | 32% |
| San Diego | 80% | 68% | 59% | 37% | 35% | 50% | 40% | 31% |
| San Francisco | 86% | 77% | 64% | 46% | 43% | 54% | 46% | 39% |
| San Jose | 89% | 80% | 63% | 48% | 43% | 57% | 45% | 37% |
| Seattle | 85% | 76% | 61% | 51% | 47% | 55% | 47% | 41% |
| Spokane | 85% | 72% | 58% | 41% | 36% | 49% | 36% | 30% |
| St. Louis | 81% | 64% | 52% | 29% | 30% | 48% | 35% | 24% |
| Tampa | 79% | 68% | 50% | 35% | 31% | 46% | 35% | 29% |
| Washington DC | 82% | 69% | 60% | 48% | 43% | 58% | 50% | 41% |
| Support at least one | ADUs | Du/ triplex | Four/ fiveplex | Sixplex | Small condo/ apartment (fewer than 10 units) | Medium condo/ apartment (10-49 units) | Large condo/ apartment (50+ units) | |
| Total | 82% | 70% | 59% | 45% | 40% | 52% | 45% | 38% |
| Homeowner | 78% | 68% | 53% | 38% | 34% | 46% | 39% | 33% |
| Renter | 89% | 73% | 71% | 59% | 51% | 63% | 57% | 50% |
| Suburban | 78% | 67% | 52% | 36% | 31% | 46% | 37% | 30% |
| Urban | 89% | 74% | 72% | 61% | 55% | 65% | 60% | 53% |
| Gen Z (Ages 18 – 28) | 91% | 77% | 67% | 53% | 52% | 61% | 55% | 52% |
| Millennial (Ages 29 – 43) | 91% | 80% | 73% | 61% | 56% | 67% | 62% | 55% |
| Generation X (Ages 44 – 58) | 82% | 73% | 60% | 44% | 39% | 50% | 44% | 36% |
| Boomers + Silent Gen (59+) | 69% | 55% | 41% | 26% | 20% | 36% | 26% | 18% |
| Ages 18-29 | 92% | 77% | 68% | 54% | 52% | 62% | 56% | 52% |
| Ages 30-39 | 90% | 80% | 73% | 62% | 57% | 68% | 62% | 55% |
| Ages 40-49 | 88% | 79% | 70% | 54% | 47% | 57% | 53% | 46% |
| Ages 50-59 | 78% | 68% | 50% | 36% | 30% | 44% | 37% | 28% |
| Age 60+ | 67% | 53% | 41% | 24% | 19% | 35% | 25% | 18% |
| White | 79% | 69% | 55% | 39% | 34% | 47% | 39% | 33% |
| Black | 84% | 68% | 66% | 52% | 46% | 59% | 54% | 46% |
| Latinx | 88% | 73% | 65% | 55% | 51% | 60% | 54% | 49% |
| AAPI | 82% | 71% | 58% | 41% | 35% | 53% | 45% | 35% |
| Other race | 82% | 69% | 53% | 40% | 35% | 47% | 39% | 31% |
| Non-White | 85% | 71% | 63% | 50% | 45% | 57% | 51% | 43% |
| Cisgender Heterosexual | 81% | 69% | 57% | 43% | 38% | 51% | 44% | 36% |
| LGBTQ+ | 91% | 78% | 73% | 61% | 54% | 66% | 59% | 54% |
| <$50K HH Income | 78% | 65% | 62% | 49% | 42% | 55% | 46% | 40% |
| $50K-<$100K HH Income | 81% | 69% | 57% | 43% | 37% | 52% | 44% | 36% |
| $100K+ HH Income | 92% | 73% | 59% | 44% | 40% | 51% | 45% | 38% |
| Not registered to vote | 83% | 66% | 55% | 40% | 36% | 49% | 42% | 37% |
| Registered to vote at current address | 82% | 69% | 57% | 42% | 36% | 50% | 42% | 34% |
| Registered to vote before, but has not updated registration since moving | 82% | 77% | 75% | 65% | 61% | 67% | 66% | 61% |
| Voted in Presidential election | 81% | 70% | 58% | 43% | 37% | 52% | 44% | 36% |
| Did not vote in most recent presidential election | 85% | 69% | 61% | 49% | 46% | 53% | 48% | 44% |
| Voted in congressional election (federal house and/or senate) | 79% | 68% | 55% | 40% | 35% | 49% | 40% | 33% |
| Did not vote in most recent congressional election | 85% | 72% | 63% | 50% | 44% | 56% | 50% | 43% |
| Voted in state government (state legislature, governor) election | 80% | 69% | 55% | 40% | 35% | 49% | 40% | 34% |
| Did not vote in most recent state government election | 84% | 71% | 63% | 50% | 45% | 56% | 51% | 44% |
| Voted in local government (city and/or county council, school board) election | 79% | 69% | 56% | 39% | 33% | 48% | 39% | 32% |
| Did not vote in most recent local government election | 84% | 71% | 62% | 50% | 45% | 56% | 51% | 44% |
| Employed | 86% | 75% | 64% | 51% | 46% | 58% | 52% | 45% |
| Not Employed | 72% | 59% | 46% | 30% | 25% | 39% | 30% | 22% |
Most respondents (69%) also said allowing small and medium apartment buildings would have a positive impact on the availability of more affordable housing options, but they split more evenly on apartment buildings in their own backyards: Across all the surveyed metros, 57% agreed they would support a multifamily residence like an apartment building being built in their neighborhood, while 36% disagreed.
Allowing small and medium apartments in residential neighborhoods would have a positive impact on…
| Availability of more affordable housing options | Encourage residents to use public transportation or other alternatives to driving (e.g. walking, biking) | Make alternatives to driving, such as public transportation, biking and walking more desirable | |
| Total | 70% | 64% | 66% |
| Atlanta | 67% | 57% | 60% |
| Baltimore | 62% | 59% | 61% |
| Boston | 73% | 63% | 69% |
| Chicago | 69% | 67% | 66% |
| Cincinnati | 68% | 58% | 63% |
| Dallas | 64% | 60% | 66% |
| Denver | 71% | 62% | 61% |
| Detroit | 66% | 58% | 59% |
| Houston | 67% | 59% | 65% |
| Jacksonville | 65% | 57% | 62% |
| Las Vegas | 67% | 59% | 61% |
| Los Angeles | 73% | 72% | 76% |
| Miami | 74% | 67% | 69% |
| Minneapolis | 70% | 67% | 69% |
| Nashville | 61% | 52% | 53% |
| New York | 70% | 67% | 66% |
| Philadelphia | 67% | 62% | 64% |
| Phoenix | 69% | 61% | 64% |
| Raleigh | 66% | 58% | 62% |
| Riverside | 68% | 58% | 63% |
| Sacramento | 65% | 61% | 61% |
| San Diego | 72% | 57% | 63% |
| San Francisco | 75% | 68% | 68% |
| San Jose | 78% | 64% | 64% |
| Seattle | 74% | 68% | 67% |
| Spokane | 71% | 56% | 62% |
| St. Louis | 65% | 55% | 58% |
| Tampa | 67% | 58% | 65% |
| Washington DC | 77% | 65% | 72% |
| Availability of more affordable housing options | Encourage residents to use public transportation or other alternatives to driving (e.g. walking, biking) | Make alternatives to driving, such as public transportation, biking and walking more desirable | |
| Total | 70% | 64% | 66% |
| Homeowner | 66% | 59% | 62% |
| Renter | 78% | 73% | 74% |
| Suburban | 65% | 57% | 61% |
| Urban | 78% | 77% | 76% |
| Gen Z (Ages 18 – 28) | 77% | 76% | 75% |
| Millennial (Ages 29 – 43) | 81% | 76% | 79% |
| Generation X (Ages 44 – 58) | 70% | 62% | 65% |
| Boomers + Silent Gen (59+) | 56% | 48% | 51% |
| Ages 18-29 | 77% | 75% | 76% |
| Ages 30-39 | 81% | 77% | 79% |
| Ages 40-49 | 76% | 67% | 71% |
| Ages 50-59 | 67% | 58% | 59% |
| Age 60+ | 55% | 47% | 52% |
| White | 67% | 59% | 62% |
| Black | 75% | 71% | 73% |
| Latinx | 75% | 73% | 72% |
| AAPI | 68% | 64% | 67% |
| Other race | 65% | 57% | 64% |
| Non-White | 73% | 69% | 71% |
| Cisgender Heterosexual | 69% | 63% | 65% |
| LGBTQ+ | 80% | 76% | 77% |
| <$50K HH Income | 62% | 62% | 63% |
| $50K-<$100K HH Income | 68% | 61% | 64% |
| $100K+ HH Income | 83% | 79% | 81% |
| Not registered to vote | 71% | 65% | 68% |
| Registered to vote at current address | 69% | 64% | 65% |
| Registered to vote before, but has not updated registration since moving | 70% | 64% | 66% |
| Voted in Presidential election | 70% | 63% | 65% |
| Did not vote in most recent presidential election | 70% | 67% | 69% |
| Voted in congressional election (federal house and/or senate) | 68% | 59% | 61% |
| Did not vote in most recent congressional election | 72% | 69% | 71% |
| Voted in state government (state legislature, governor) election | 68% | 59% | 63% |
| Did not vote in most recent state government election | 72% | 69% | 70% |
| Voted in local government (city and/or county council, school board) election | 68% | 58% | 62% |
| Did not vote in most recent local government election | 71% | 69% | 70% |
| Employed | 74% | 69% | 71% |
| Not Employed | 59% | 51% | 54% |
Opponents who reported opposing every type of multifamily home (15% of adults surveyed), though, were less likely to say that each condition would make them more supportive: Only about one in five said requiring that at least 10% of new units be affordable to low and middle income families would make them more supportive (19%, versus 57% who said it would make them more opposed). A slightly higher share said that requiring that newly built multifamily homes be within a 15-minute walk from parks and recreation (23%) or frequent transit (23%) would make them more supportive. Under half (43%) said these same 15-minute requirements would make them more opposed.
Results are largely similar among registered voters: 69% say they support allowing ADUs in their neighborhood, and 57% say they support allowing duplexes and triplexes. Adults who had registered to vote previously – but who had not updated their registration since their last move – were most likely to express support for allowing more types of homes in their neighborhoods, like ADUs (77%), du/triplexes (75%), four/fiveplexes (65%), sixplexes (61%), and small (67%), medium (66%), and large (61%) condos/apartments.
Younger residents, renters, people of color and LGBTQ+ respondents were more likely to express support for allowing accessory dwelling units, duplexes and triplexes in residential neighborhoods, and were more likely to agree that they would support building each type of home in their own neighborhoods. These more supportive demographics, though, were less likely to report having up-to-date voter registration. For example, 65% of LGBTQ+ respondents said they were registered to vote at their current address, versus 77% among cisgender heterosexual respondents.
Across the metros, most respondents said that allowing duplexes and triplexes would have a positive impact on most neighborhood characteristics they were asked about. The largest share of respondents felt this would positively impact neighborhood amenities (69%) and affordability (69%), followed by access to public transportation (64%), a sense of community and belonging (63%), neighborhood look and feel (58%), and the value of existing homes (55%). Most respondents (76%) also said that allowing homeowners to add additional units to their property would have a positive impact on enabling them to care for aging family members.
Share of adults that agreed somewhat/strongly with each statement
| I am worried about the cost of housing in my neighborhood | Local governments should do more to keep housing in this city affordable | Homeowners should be allowed to convert their homes to add additional housing units (e.g. single-family to duplex, adding a mother- in-law unit, etc.) | Multi-family housing units are acceptable in my neighborhood if they fit into the general “look and feel” of the neighborhood | I’m very worried about traffic and parking in my neighborhood | I would support a multi-family residence, such as an apartment building or complex, being built in my neighborhood | I would be willing to invest money to make my property a multi-family lot if it were allowed | Having more affordable housing in my community is more important than free parking for myself | |
| Total | 65% | 82% | 70% | 63% | 48% | 57% | 46% | 62% |
| Atlanta | 59% | 81% | 65% | 56% | 43% | 50% | 43% | 61% |
| Baltimore | 55% | 78% | 70% | 55% | 43% | 47% | 33% | 56% |
| Boston | 66% | 85% | 74% | 67% | 44% | 60% | 43% | 64% |
| Chicago | 65% | 82% | 70% | 61% | 49% | 60% | 42% | 58% |
| Cincinnati | 51% | 79% | 62% | 53% | 40% | 49% | 35% | 57% |
| Dallas | 69% | 76% | 67% | 58% | 50% | 56% | 48% | 61% |
| Denver | 73% | 79% | 70% | 60% | 49% | 57% | 41% | 59% |
| Detroit | 55% | 80% | 64% | 61% | 35% | 50% | 40% | 60% |
| Houston | 62% | 82% | 64% | 62% | 50% | 50% | 49% | 63% |
| Jacksonville | 61% | 83% | 64% | 48% | 43% | 48% | 39% | 61% |
| Las Vegas | 62% | 84% | 63% | 59% | 45% | 52% | 45% | 59% |
| Los Angeles | 72% | 85% | 76% | 72% | 58% | 64% | 60% | 68% |
| Miami | 67% | 82% | 65% | 68% | 52% | 61% | 51% | 64% |
| Minneapolis | 61% | 81% | 70% | 66% | 37% | 54% | 35% | 61% |
| Nashville | 61% | 79% | 66% | 51% | 42% | 41% | 37% | 56% |
| New York | 65% | 84% | 71% | 66% | 49% | 62% | 49% | 65% |
| Philadelphia | 57% | 77% | 71% | 61% | 42% | 51% | 38% | 54% |
| Phoenix | 65% | 79% | 69% | 56% | 45% | 51% | 42% | 61% |
| Raleigh | 59% | 78% | 59% | 53% | 41% | 45% | 35% | 62% |
| Riverside | 66% | 84% | 70% | 56% | 46% | 51% | 47% | 61% |
| Sacramento | 70% | 77% | 69% | 57% | 46% | 48% | 40% | 59% |
| San Diego | 76% | 83% | 71% | 69% | 53% | 56% | 47% | 58% |
| San Francisco | 71% | 84% | 77% | 69% | 58% | 60% | 47% | 63% |
| San Jose | 70% | 86% | 80% | 73% | 57% | 56% | 51% | 61% |
| Seattle | 75% | 86% | 76% | 66% | 55% | 58% | 42% | 68% |
| Spokane | 75% | 85% | 69% | 52% | 45% | 49% | 32% | 65% |
| St. Louis | 50% | 78% | 65% | 55% | 39% | 44% | 28% | 50% |
| Tampa | 62% | 84% | 67% | 56% | 51% | 47% | 40% | 63% |
| Washington DC | 64% | 84% | 74% | 62% | 44% | 57% | 53% | 63% |
| Homeowner | 60% | 80% | 68% | 60% | 47% | 49% | 44% | 56% |
| Renter | 76% | 87% | 74% | 70% | 52% | 72% | 52% | 74% |
| Suburban | 62% | 79% | 65% | 57% | 42% | 48% | 39% | 55% |
| Urban | 71% | 89% | 79% | 75% | 60% | 73% | 59% | 74% |
| Gen Z (Ages 18 – 28) | 68% | 87% | 77% | 67% | 49% | 66% | 58% | 73% |
| Millennial (Ages 29 – 43) | 70% | 85% | 78% | 75% | 56% | 74% | 66% | 74% |
| Generation X (Ages 44 – 58) | 69% | 84% | 72% | 65% | 49% | 56% | 47% | 62% |
| Boomers + Silent Gen (59+) | 55% | 76% | 58% | 49% | 40% | 37% | 21% | 46% |
| Ages 18-29 | 68% | 87% | 77% | 68% | 50% | 67% | 59% | 73% |
| Ages 30-39 | 70% | 85% | 79% | 75% | 57% | 74% | 66% | 73% |
| Ages 40-49 | 71% | 86% | 78% | 71% | 54% | 67% | 57% | 71% |
| Ages 50-59 | 67% | 79% | 66% | 58% | 45% | 47% | 39% | 55% |
| Age 60+ | 55% | 76% | 57% | 49% | 39% | 35% | 19% | 45% |
| White | 62% | 80% | 67% | 61% | 45% | 50% | 38% | 58% |
| Black | 64% | 91% | 75% | 67% | 45% | 67% | 54% | 71% |
| Latinx | 69% | 82% | 75% | 67% | 56% | 67% | 60% | 69% |
| AAPI | 74% | 85% | 67% | 63% | 49% | 55% | 49% | 59% |
| Other race | 66% | 80% | 68% | 58% | 51% | 49% | 39% | 57% |
| Non-White | 68% | 85% | 73% | 65% | 51% | 63% | 54% | 66% |
| Cisgender Heterosexual | 64% | 82% | 70% | 62% | 47% | 55% | 45% | 61% |
| LGBTQ+ | 74% | 87% | 75% | 72% | 59% | 69% | 59% | 75% |
| <$50K HH Income | 63% | 77% | 67% | 57% | 42% | 57% | 42% | 61% |
| $50K-<$100K HH Income | 64% | 82% | 69% | 62% | 47% | 53% | 43% | 60% |
| $100K+ HH Income | 70% | 87% | 82% | 76% | 61% | 75% | 69% | 77% |
| Not registered to vote | 69% | 83% | 69% | 64% | 50% | 62% | 48% | 67% |
| Registered to vote at current address | 67% | 83% | 71% | 61% | 48% | 54% | 44% | 63% |
| Registered to vote before, but has not updated registration since moving | 62% | 81% | 71% | 64% | 48% | 55% | 47% | 59% |
| Voted in Presidential election | 64% | 83% | 70% | 63% | 48% | 54% | 43% | 61% |
| Did not vote in most recent presidential election | 67% | 80% | 70% | 63% | 50% | 62% | 53% | 64% |
| Voted in congressional election (federal house and/or senate) | 63% | 79% | 67% | 60% | 48% | 51% | 39% | 57% |
| Did not vote in most recent congressional election | 67% | 86% | 73% | 66% | 49% | 63% | 53% | 67% |
| Voted in state government (state legislature, governor) election | 63% | 81% | 68% | 61% | 47% | 50% | 40% | 58% |
| Did not vote in most recent state government election | 67% | 84% | 73% | 65% | 50% | 64% | 53% | 67% |
| Voted in local government (city and/or county council, school board) election | 64% | 81% | 68% | 61% | 46% | 49% | 38% | 57% |
| Did not vote in most recent local government election | 66% | 84% | 72% | 65% | 50% | 63% | 53% | 67% |
| Employed | 68% | 85% | 75% | 69% | 52% | 63% | 55% | 67% |
| Not Employed | 57% | 76% | 59% | 50% | 41% | 40% | 25% | 50% |
About half, however, said allowing such homes would have a negative impact on parking and traffic (48%). On this point, though, 62% agreed with the statement “Having more affordable housing in my community is more important than free parking for myself.”
| Homeowners should be allowed to convert their homes to add additional housing units (e.g., single-family to duplex, adding a mother-in-law unit, etc.) | 2019 | 2022 | 2023 |
| Total – Among homeowners only | 57% | 64% | 68% |
| Atlanta | 54% | 57% | 61% |
| Boston | 63% | 72% | 69% |
| Chicago | 52% | 68% | 67% |
| Dallas | 51% | 63% | 66% |
| Denver | 54% | 57% | 70% |
| Detroit | 47% | 56% | 62% |
| Las Vegas | 52% | 56% | 61% |
| Los Angeles | 57% | 70% | 75% |
| Miami | 63% | 57% | 65% |
| Minneapolis | 57% | 55% | 68% |
| New York | 55% | 66% | 70% |
| Philadelphia | 58% | 68% | 68% |
| Phoenix | 50% | 60% | 64% |
| St. Louis | 53% | 60% | 63% |
| San Diego | 70% | 62% | 74% |
| San Francisco | 64% | 64% | 75% |
| San Jose | 60% | 66% | 82% |
| Seattle | 67% | 69% | 73% |
| Tampa | 58% | 65% | 67% |
| Washington, D.C. | 59% | 59% | 73% |
In order to gain a comprehensive understanding of adults ages 18 and older, Zillow Group Population Science conducted a representative survey of more than 14,000 adults across 29 metros: Atlanta, Baltimore, Boston, Chicago, Cincinnati, Dallas, Denver, Detroit, Houston, Jacksonville, Los Angeles, Las Vegas, Miami, Minneapolis, Nashville, New York, Philadelphia, Phoenix, Raleigh, Riverside, St. Louis, Sacramento, San Diego, San Francisco, San Jose, Seattle, Spokane, Tampa and Washington, D.C. metropolitan areas. The survey was fielded in March 2023.
Results from this survey are representative of adults in each metropolitan area. To achieve representativeness, ZG Population Science used a two-pronged approach. First, the initial recruitment to the sample was balanced to all adults from the U.S. Census Bureau’s 2021 American Community Survey (ACS) on the basis of age, relationship status, income, ethnicity/race, education and sex. Additional targeted subgroups were sampled based on all key household demographic characteristics. Second, statistical raking was used to create calibration weights to ensure that the distribution of survey respondents matched each metro’s population with respect to a number of key demographic characteristics.
