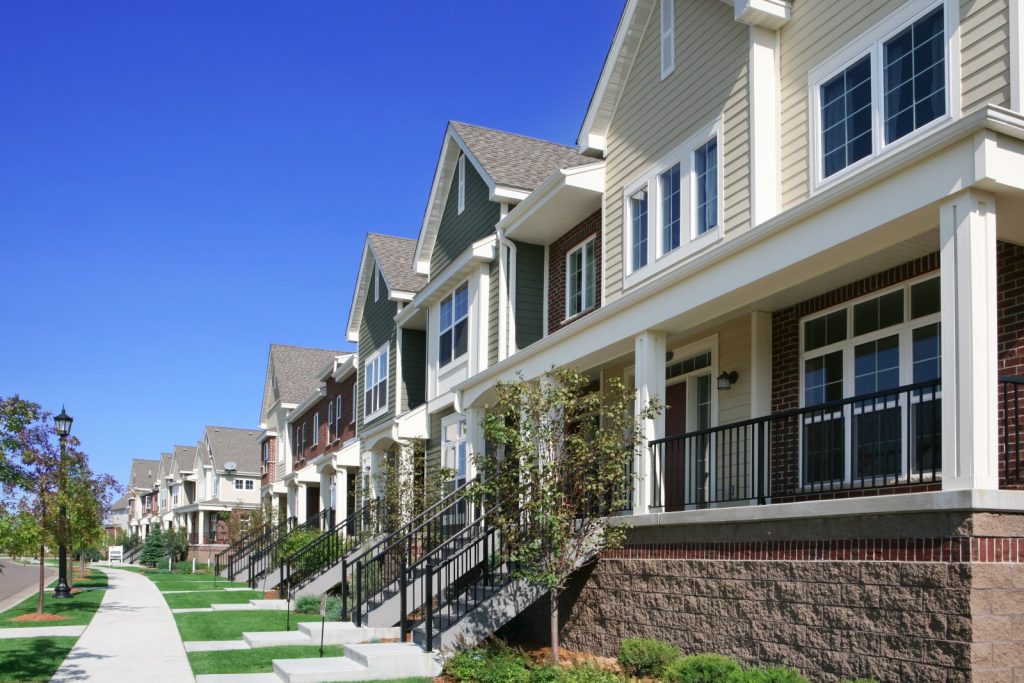
There is broad support to allow accessory dwelling units, duplexes and triplexes in residential neighborhoods, according to a new Zillow survey covering 26 U.S. metro areas, many of which are struggling with housing affordability. A clear majority of homeowners surveyed (73%) voiced support for at least one of these “modest densification” options, and support was higher among renters (84%).
Rapidly rising rents and home values have pushed housing affordability to the center of the conversation in much of the country. Record-low inventory, triggered by a lost decade of home construction that caused a shortfall of 1.35 million new homes in 35 metro areas alone, has met a massive wave of demand, fueling an ultracompetitive market and pushing housing costs to crisis levels in some markets. There is no easy fix, but building more homes is likely the most effective tool to rein in price growth. Zillow research has shown that modest densification measures — allowing two units on 10% of single-family lots across some of the largest U.S. metros — could help boost critically needed housing supply enough to meaningfully slow housing price growth. This latest survey shows a growing consensus among homeowners and renters that similar measures should be taken in their own neighborhoods to address affordability.
Across the 26 metro areas Zillow surveyed, residents were more likely to support allowing accessory dwelling units (69% supported versus 23% opposed) and duplexes and triplexes (61% supported versus 31% opposed) in every single metro.[1] Most respondents (68%) also said allowing small and medium apartment buildings would have a positive impact [2] on the availability of more affordable housing options, but they split more evenly on apartment buildings in their own backyards: Across all the surveyed metros, 57% agreed they would support a multifamily residence like an apartment building being built in their neighborhood, while 37% disagreed. [3]
Younger residents, renters, people of color and LGBTQ+ respondents were more likely to express support for allowing accessory dwelling units, duplexes and triplexes in residential neighborhoods, and were more likely to agree that they would support building an apartment building in their own neighborhoods.
Support allowing in residential neighborhoods:
|
ADUs |
Duplexes/Triplexes |
Either ADUs or Duplexes/Triplexes |
| Total |
69% |
61% |
77% |
| Homeowner |
66% |
55% |
73% |
| Renter |
76% |
72% |
84% |
| Gen Z (ages 18-27) |
78% |
69% |
86% |
| Millennial (ages 28 – 42) |
79% |
73% |
86% |
| Generation X (ages 43-57) |
71% |
60% |
78% |
| Baby Boomer and Silent Generation (ages 58+) |
54% |
46% |
64% |
| Non-Hispanic White |
68% |
58% |
76% |
| Black |
71% |
67% |
80% |
| Hispanic/Latinx |
72% |
63% |
79% |
| Asian American and Pacific Islander |
68% |
59% |
77% |
| Other Race |
75% |
66% |
81% |
| Cisgender Heterosexual |
69% |
60% |
77% |
| LGBTQ+ |
76% |
69% |
86% |
In each metro, residents were more evenly divided on allowing duplexes and triplexes in residential neighborhoods than on accessory dwelling units. In the Atlanta area, for example, 47% of respondents said they supported allowing duplexes and triplexes, versus 43% who opposed them. Accessory dwelling units (ADUs) had broader support: 68% supported allowing them, compared to 23% who opposed them.
Support allowing in residential neighborhoods:
| Metro Area |
ADUs |
Duplexes/Triplexes |
Either ADUs or Duplexes/Triplexes |
| Atlanta |
68% |
47% |
72% |
| Boston |
70% |
66% |
84% |
| Chicago |
71% |
65% |
79% |
| Cincinnati |
61% |
57% |
72% |
| Dallas |
70% |
60% |
80% |
| Denver |
73% |
63% |
79% |
| Detroit |
59% |
54% |
70% |
| Houston |
69% |
53% |
76% |
| Jacksonville |
67% |
52% |
73% |
| Las Vegas |
69% |
57% |
75% |
| Los Angeles |
75% |
67% |
84% |
| Miami |
71% |
60% |
78% |
| Minneapolis |
65% |
60% |
75% |
| Nashville |
68% |
57% |
75% |
| New York |
63% |
61% |
73% |
| Philadelphia |
68% |
60% |
77% |
| Phoenix |
75% |
57% |
81% |
| Sacramento |
72% |
65% |
78% |
| San Diego |
75% |
64% |
80% |
| San Francisco |
73% |
65% |
79% |
| San Jose |
80% |
57% |
84% |
| Seattle |
72% |
66% |
78% |
| Spokane |
81% |
69% |
86% |
| St. Louis |
69% |
58% |
74% |
| Tampa |
68% |
62% |
79% |
| Washington, D.C. |
71% |
62% |
80% |
Across the metros, most respondents said that allowing duplexes and triplexes would have a positive impact on most neighborhood characteristics they were asked about. The largest share of respondents felt this would positively impact neighborhood amenities (68%), followed by affordability (67%), access to public transportation (63%), a sense of community and belonging (62%), neighborhood look and feel (55%), and the value of existing homes (53%).
More than half, however, said allowing such homes would have a negative impact on parking and traffic (54%). On this point, though, 61% agreed with the statement “Having more affordable housing in my community is more important than free parking for myself.”
Allowing duplexes and triplexes in residential neighborhoods would have a positive impact on…
|
The value of existing homes in that neighborhood |
The look and feel of that neighborhood |
Parking and traffic |
Sense of community and belonging |
Availability of more affordable housing options |
Access to public transportation |
Neighborhood amenities (e.g. parks, restaurants, community centers) |
| Total |
53% |
55% |
37% |
62% |
67% |
63% |
68% |
| Homeowner |
49% |
49% |
34% |
57% |
64% |
59% |
64% |
| Renter |
61% |
65% |
43% |
72% |
73% |
71% |
74% |
| Gen Z (ages 18-27) |
61% |
65% |
45% |
74% |
75% |
66% |
74% |
| Millennial (ages 28 – 42) |
65% |
65% |
49% |
72% |
77% |
73% |
76% |
| Generation X (ages 43-57) |
51% |
53% |
35% |
60% |
67% |
63% |
66% |
| Baby Boomer + Silent Generation (58+) |
39% |
41% |
23% |
49% |
54% |
51% |
58% |
| Non-Hispanic White |
46% |
48% |
32% |
58% |
65% |
57% |
64% |
| Black |
63% |
65% |
48% |
69% |
70% |
73% |
74% |
| Latinx |
63% |
64% |
44% |
70% |
71% |
70% |
74% |
| Asian American and Pacific Islander |
54% |
56% |
32% |
59% |
71% |
64% |
66% |
| Other Race |
49% |
50% |
38% |
58% |
62% |
61% |
61% |
| Cisgender/Heterosexual |
52% |
55% |
37% |
62% |
67% |
62% |
67% |
| LGBTQ+ |
59% |
59% |
40% |
70% |
72% |
68% |
70% |
Allowing duplexes and triplexes in residential neighborhoods would have a positive impact on…
|
The value of existing homes in that neighborhood |
The look and feel of that neighborhood |
Parking and traffic |
Sense of community and belonging |
Availability of more affordable housing options |
Access to public transportation |
Neighborhood amenities (e.g. parks, restaurants, community centers) |
| Atlanta |
45% |
48% |
35% |
56% |
63% |
52% |
59% |
| Boston |
55% |
54% |
38% |
66% |
73% |
65% |
71% |
| Chicago |
54% |
57% |
40% |
67% |
68% |
66% |
71% |
| Cincinnati |
50% |
53% |
39% |
64% |
63% |
61% |
67% |
| Dallas |
52% |
56% |
39% |
62% |
66% |
61% |
69% |
| Denver |
43% |
47% |
29% |
56% |
67% |
61% |
66% |
| Detroit |
48% |
48% |
36% |
56% |
62% |
54% |
59% |
| Houston |
52% |
55% |
37% |
62% |
63% |
59% |
69% |
| Jacksonville |
45% |
46% |
38% |
59% |
62% |
60% |
60% |
| Las Vegas |
53% |
59% |
44% |
59% |
65% |
64% |
69% |
| Los Angeles |
64% |
62% |
40% |
69% |
71% |
69% |
73% |
| Miami |
64% |
67% |
49% |
70% |
69% |
69% |
75% |
| Minneapolis |
41% |
47% |
25% |
55% |
64% |
56% |
64% |
| Nashville |
44% |
50% |
30% |
57% |
65% |
50% |
63% |
| New York |
57% |
60% |
41% |
63% |
66% |
65% |
67% |
| Philadelphia |
51% |
56% |
35% |
64% |
68% |
66% |
64% |
| Phoenix |
48% |
47% |
32% |
56% |
64% |
62% |
66% |
| Sacramento |
43% |
47% |
35% |
55% |
64% |
57% |
62% |
| San Diego |
49% |
58% |
31% |
62% |
73% |
64% |
71% |
| San Francisco |
51% |
51% |
33% |
57% |
71% |
65% |
67% |
| San Jose |
45% |
50% |
29% |
58% |
72% |
57% |
64% |
| Seattle |
48% |
45% |
26% |
56% |
67% |
64% |
62% |
| Spokane |
47% |
52% |
36% |
61% |
74% |
62% |
67% |
| St. Louis |
46% |
49% |
33% |
60% |
64% |
56% |
66% |
| Tampa |
48% |
50% |
36% |
62% |
65% |
63% |
69% |
| Washington, D.C. |
53% |
52% |
31% |
59% |
70% |
64% |
68% |
When asked about the impact that duplexes, triplexes and small/medium apartment buildings would have on the availability of affordable housing options, about two-thirds of respondents said that duplexes/triplexes (67%) and small/medium apartment buildings (68%) would have a positive impact.
Despite this, the response was more muted when asked whether they would support an apartment building being built in their neighborhood. Only 57% agreed they would support a multifamily residence, such as an apartment building or complex, being built in their neighborhood. While renters overall had a 4-point gap between acknowledging a positive impact on affordability (76%) and supporting apartment construction in their neighborhood (72%), homeowners revealed a much larger, 15-point gap: 63% said allowing small/medium apartment buildings would have a positive impact on affordability, while only 48% agreed they would support apartment construction in their neighborhood.
Allowing small and medium apartments in residential neighborhoods would have a positive impact on…
|
Availability of more affordable housing options |
Encourage residents to use public transportation or other alternatives to driving (e.g. walking, biking) |
Make alternatives to driving, such as public transportation, biking and walking more desirable |
Agree they would support an apartment building being built in their neighborhood |
| Total |
68% |
59% |
63% |
57% |
| Homeowner |
63% |
55% |
59% |
48% |
| Renter |
76% |
67% |
70% |
72% |
| Gen Z (ages 18-27) |
80% |
69% |
72% |
72% |
| Millennial (ages 28 – 42) |
76% |
72% |
74% |
70% |
| Generation X (ages 43-57) |
67% |
57% |
62% |
51% |
| Baby Boomer + Silent Generation (ages 58+) |
55% |
45% |
49% |
40% |
| Non-Hispanic White |
65% |
55% |
58% |
50% |
| Black |
72% |
64% |
70% |
69% |
| Latinx |
71% |
66% |
70% |
63% |
| Asian American and Pacific Islander |
70% |
64% |
66% |
57% |
| Other Race |
66% |
55% |
61% |
53% |
| Cisgender/Heterosexual |
67% |
59% |
62% |
55% |
| LGBTQ+ |
74% |
70% |
73% |
68% |
Among the metro areas surveyed, the Boston and Spokane metros had the largest gaps between acknowledging a positive impact on affordability and agreeing with apartment construction in their own neighborhoods: Both of these metros had a 20-point gap. In the Boston area, for example, 76% of residents said that allowing apartments would have a positive impact on affordability, but only 56% agreed they would support building an apartment complex in their neighborhood.
Allowing small and medium apartments in residential neighborhoods would have a positive impact on…
|
Availability of more affordable housing options |
Encourage residents to use public transportation or other alternatives to driving (e.g. walking, biking) |
Make alternatives to driving, such as public transportation, biking and walking more desirable |
Agree they would support an apartment building being built in their neighborhood |
| Atlanta |
59% |
49% |
54% |
46% |
| Boston |
76% |
64% |
66% |
56% |
| Chicago |
70% |
63% |
62% |
59% |
| Cincinnati |
66% |
62% |
62% |
54% |
| Dallas |
64% |
55% |
60% |
55% |
| Denver |
66% |
59% |
59% |
53% |
| Detroit |
62% |
54% |
58% |
54% |
| Houston |
63% |
52% |
60% |
52% |
| Jacksonville |
61% |
55% |
57% |
52% |
| Las Vegas |
67% |
59% |
67% |
54% |
| Los Angeles |
72% |
66% |
67% |
63% |
| Miami |
70% |
64% |
74% |
63% |
| Minneapolis |
64% |
56% |
57% |
50% |
| Nashville |
62% |
51% |
57% |
54% |
| New York |
72% |
61% |
68% |
64% |
| Philadelphia |
66% |
57% |
63% |
54% |
| Phoenix |
63% |
60% |
59% |
48% |
| Sacramento |
62% |
56% |
59% |
52% |
| San Diego |
70% |
60% |
62% |
55% |
| San Francisco |
68% |
65% |
59% |
58% |
| San Jose |
75% |
65% |
64% |
60% |
| Seattle |
71% |
59% |
62% |
53% |
| Spokane |
70% |
59% |
69% |
50% |
| St. Louis |
67% |
50% |
56% |
50% |
| Tampa |
64% |
60% |
58% |
52% |
| Washington, D.C. |
70% |
58% |
63% |
54% |
Since a similar survey was conducted in 2019, homeowners overall became slightly more likely to agree that they should be allowed to convert their homes to add housing units, growing from 57% in 2019 to 64% in 2022. The Chicago metro area saw a 16-point increase from 2019, and similarly large increases emerged in the Los Angeles (13 points), Dallas (12 points) and New York (11 points) metros.
Homeowners should be allowed to convert their homes to add additional housing units (e.g., single-family to duplex, adding a mother- in-law unit, etc.)
|
2019 |
2022 |
Change, if statistically significant |
| Total |
57% |
64% |
+7 points |
| Atlanta |
54% |
57% |
— |
| Boston |
63% |
72% |
+9 points |
| Chicago |
52% |
68% |
+16 points |
| Dallas |
51% |
63% |
+12 points |
| Denver |
54% |
57% |
— |
| Detroit |
47% |
56% |
+9 points |
| Las Vegas |
52% |
56% |
— |
| Los Angeles |
57% |
70% |
+13 points |
| Miami |
63% |
57% |
— |
| Minneapolis |
57% |
55% |
— |
| New York |
55% |
66% |
+11 points |
| Philadelphia |
58% |
68% |
+10 points |
| Phoenix |
50% |
60% |
+10 points |
| St. Louis |
53% |
60% |
— |
| San Diego |
70% |
62% |
— |
| San Francisco |
64% |
64% |
— |
| San Jose |
60% |
66% |
— |
| Seattle |
67% |
69% |
— |
| Tampa |
58% |
65% |
— |
| Washington, D.C. |
59% |
59% |
— |
Methodology
In order to gain a comprehensive understanding of adults ages 18 and older, Zillow Group Population Science conducted a representative survey of more than 12,000 adults across 26 metros: Atlanta, Boston, Chicago, Cincinnati, Dallas, Denver, Detroit, Houston, Jacksonville, Los Angeles, Las Vegas, Miami, Minneapolis, Nashville, New York, Philadelphia, Phoenix, St. Louis, Sacramento, San Diego, San Francisco, San Jose, Seattle, Spokane, Tampa and Washington, D.C. metropolitan areas. The survey was fielded from January through March 2022. This was the first year that ZG Population Science designed, fielded and analyzed the survey entirely in-house.
Sampling & Weighting
Results from this survey are representative of adults in each metropolitan area. To achieve representativeness, ZG Population Science used a two-pronged approach. First, the initial recruitment to the sample was balanced to all adults from the U.S. Census Bureau’s 2019 American Community Survey (ACS) on the basis of age, relationship status, income, ethnicity/race, education and sex. Additional targeted subgroups were sampled based on all key household demographic characteristics. Second, statistical raking was used to create calibration weights to ensure that the distribution of survey respondents matched each metro’s population with respect to a number of key demographic characteristics.
[1] For both of these questions, response options were: Strongly support, somewhat support, somewhat oppose, strongly oppose, and not sure. “Support” in this context refers to those that said they supported somewhat or strongly, and “oppose” refers to those that say they opposed somewhat or strongly.
[2] Response options were: Very positive, somewhat positive, somewhat negative, very negative, and not sure. “Positive” is shorthand for respondents that said allowing duplexes, triplexes, and/or small/medium apartments would have a very or somewhat positive impact. “Negative” is shorthand for respondents that said each would have a very or somewhat negative impact.
[3] Response options were: Strongly agree, somewhat agree, somewhat disagree, strongly disagree, not sure.
