10 Most Affordable Markets for Renters
See 10 major metros where people spend less than 25 percent of their area's median income on the rent.

July 18, 2019
Written by Zillow Research
Affordability is a relative concept in housing. Markets that seem affordable because their median rent is on the low side may actually be unaffordable to people who make the typical wage there. So, we measure affordability by the share of median household income that residents pay for an area's median rent.
In the United States, typical renters spend 27.8% of their incomes on rent. These markets are the most affordable among the largest 50 metro areas -- updated with data from the first quarter 2019. (Median monthly rent data are from May 2019.)
1. Pittsburgh, PA

% of household income spent on rent: 21.4%
nAverage % spent on rent, 1985-1999: 28.4%
nMedian monthly rent: $1,105
2. St. Louis, MO

% of household income spent on rent: 21.5%
nAverage % spent on rent 1985-1999: 21.2%
nMedian monthly rent: $1,163
3. Oklahoma City, OK

% of household income spent on rent: 22.5%
nAverage % spent on rent 1985-1999: 20.6%
nMedian monthly rent: $1,119
4. Raleigh, NC

% of household income spent on rent: 23.2%
nAverage % spent on rent 1985-1999: 18.9%
nMedian monthly rent: $1,476
5. Kansas City, MO

% of household income spent on rent: 23.4%
nAverage % spent on rent 1985-1999: 17.5%
nMedian monthly rent: $1,303
6. Indianapolis, IN

% of household income spent on rent: 23.8%
nAverage % spent on rent 1985-1999: 21.8%
nMedian monthly rent: $1,239
7. (tie) Detroit, MI
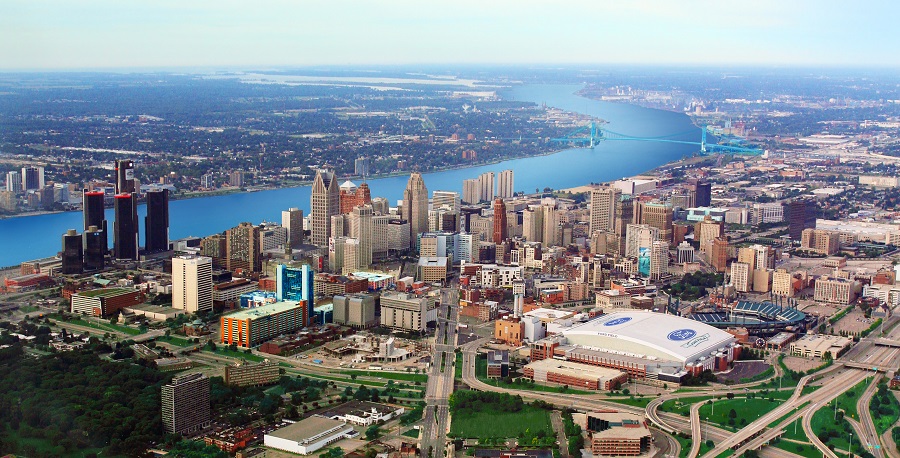
% of household income spent on rent: 24%
nAverage % spent on rent 1985-1999: 20%
nMedian monthly rent: $1,229
7. (tie) Louisville, KY

% of household income spent on rent: 24%
nAverage % spent on rent 1985-1999: 19.9%
nMedian monthly rent: $1,198
9. Birmingham, AL

% of household income spent on rent: 24.1%
nAverage % spent on rent, 1985-1999: 19.2%
nMedian monthly rent: $1,111
10. Cincinnati

% of household income spent on rent: 24.2%
nAverage % spent on rent 1985-1999: 19.1%
nMedian monthly rent: $1,305

Related Articles



Research in your inbox
Get the latest housing data and analysis from Zillow's economists — delivered when the numbers update.

