Homes in Black Neighborhoods Twice as Likely to be Underwater as Homes in White Neighborhoods
Nationwide and in a number of large metro markets, the negative equity rate in largely black communities is double or more the rate in majority white communities. The disparities reflect the wide gulf that exists between white America and communities of color and their very different experiences throughout the housing boom, bust and recovery.
- Nationwide, the negative equity rate in communities in which a majority of homeowners were black was 20 percent as of Q3 2016. The negative equity rate in largely white neighborhoods was 9.9 percent.
- In half of the largest U.S. metros, homeowners in predominantly black neighborhoods are more likely to be underwater than homeowners in other neighborhoods.
- The negative equity rate in communities where the majority of residents are Hispanic was 12 percent in Q3 2016.
Nationwide and in a number of large metro markets, the negative equity rate in largely black communities is double or more the rate in majority white communities. The disparities reflect the wide gulf that exists between white America and communities of color and their very different experiences throughout the housing boom, bust and recovery.
As of the third quarter of 2016, the negative equity rate – the share of homeowners with a mortgage that were underwater, owing more than their home is worth – in communities nationwide in which the majority of mortgaged homeowners were white was 9.9 percent. In majority black communities nationwide, the negative equity rate was 20 percent. The negative equity rate in the nation’s predominantly Hispanic communities stood at 12 percent (figure 1).
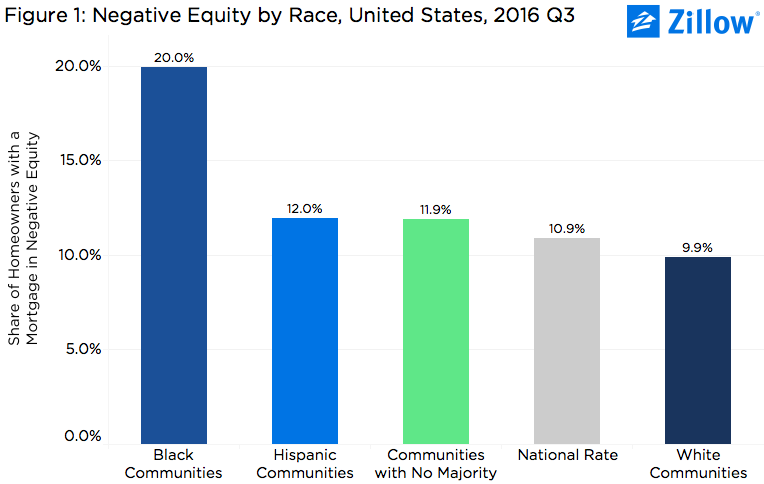 Interestingly, the negative equity rate in the country’s more mixed communities – places in which no single race represented a majority of homeowners – the negative equity rate was 11.9 percent, lower than the rate in both majority Hispanic and black neighborhoods. In the third quarter, the overall negative equity rate among all mortgaged homeowners nationwide, regardless of race, was 10.9 percent.
Separate and Unequal
During the bust, home values in largely Hispanic and black communities nationwide fell much farther than in white communities. And since the recovery began, home values in black communities especially have bounced back at a far slower pace. The depth of the housing recession, coupled with a much weaker recovery, means that many homeowners in these communities have not been able to regain home equity at the same pace as their peers in white communities.
Additionally, black and Hispanic mortgage applicants – the borrowers most likely to buy homes in these communities and prop up demand, which would help home values bounce back more strongly – face a number of challenges in the mortgage process that white applicants don’t. As a result, black and Hispanic mortgage applicants are denied at roughly twice the pace of white applicants – and that’s when they apply at all. Although blacks and Hispanics make up 12.3 percent and 17.6 percent of the U.S. population, respectively, they make up just 3 percent and 6.2 percent of conventional loan applications, according to an analysis of 2015 American Community Survey and Home Mortgage Disclosure Act data. And just 2.6 percent and 5.6 percent of black and Hispanic mortgage applications, respectively, are eventually approved.
It’s no wonder, then, that black and Hispanic homeownership rates remain much lower than white homeownership rates. Even if they’re successful buying a home, the volatility and continued weakness left over from the recession in the communities in which they buy means their grip on homeownership itself is more tenuous, reflected in their higher rates of negative equity. And being in negative equity ultimately increases a homeowner’s odds of foreclosure and the loss of wealth stored in their home, further widening the gap between the housing haves and have nots.
Local Differences
The differences in negative equity between white communities and communities of color was even more dramatic in communities within individual metros, particularly in the hard-hit Midwest, which has experienced a slower housing recovery overall compared to larger coastal markets. In Chicago, the negative equity rate in largely black communities was 28.2 percent, compared to 13.8 percent in largely white communities. In St. Louis, majority white communities had a negative equity rate of 10.8 percent; in St. Louis’ black neighborhoods, it was 28.2 percent. And in Detroit, perhaps the hardest-hit large market nationwide, the black negative equity rate was more than triple the white negative equity rate, at 35.1 percent and 9.5 percent, respectively.
Detroit offers an interesting case study for why this phenomenon has emerged. In the wake of a historic bankruptcy and a dramatic exodus of its population over the past decade, Detroit faces a number of daunting challenges and will likely never re-gain its prior standing as one of the country’s economic and cultural powerhouses. The overall negative equity rate in the Motor City is among the nation’s highest. But even with these challenges, Detroit has managed to bounce back to a point and keep its head above water, attracting new corporate tenants, new jobs and new residents to its up-and-coming downtown core – an increasing number of them white.
But even as Detroit’s downtown has bounced back, its sprawling outer neighborhoods – home to a number of minority communities – hasn’t experienced the same level of success. So while better-heeled and highly qualified potential home buyers move into downtown and help keep home values growing, blight and foreclosure still loom large over Motown’s communities of color. And where blight and foreclosure reign, negative equity is never far behind.
Use the tool below to explore varying negative equity rates in largely white, black, Hispanic and Asian communities nationwide and in individual local markets. Please note, some individual markets did not have communities in which an individual race represented a majority of homeowners. See the methodology section below for more details.
Methodology
For an in-depth explanation of how Zillow computes our base negative equity data, including how we merge our proprietary home value data with actual outstanding loan balance data provided by TransUnion (TU), please see our methodology brief here.
To calculate the negative equity rate by race, Zillow examined census tracts in which homeowners of a given race represented the majority of homeowners in that given area. Tracts that had no majority were labeled as ‘Mixed’ (or ‘No Majority’ in the output), which was treated it as its own racial group. Negative equity by race was computed at the national, metro, county and state levels.

