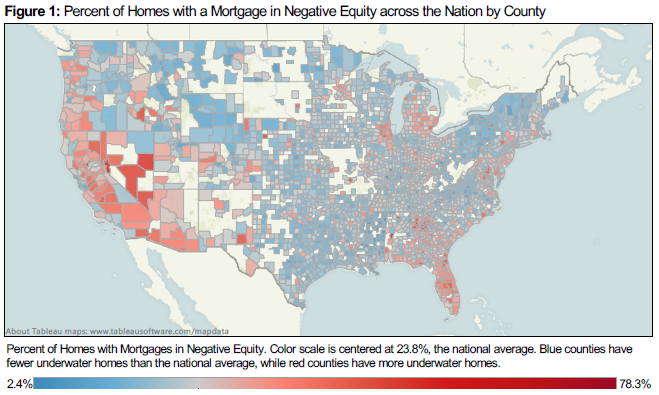
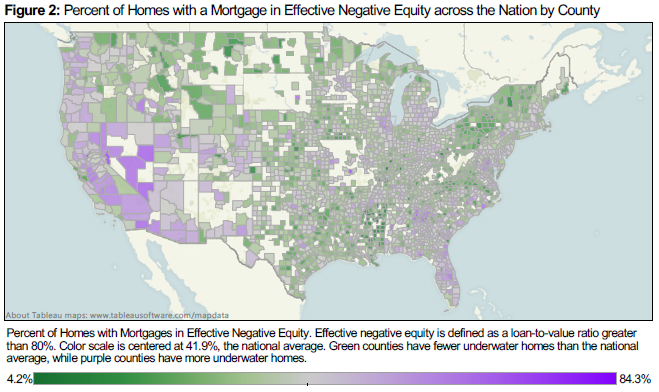
According to the second quarter Zillow Negative Equity Report, the national negative equity rate continued to fall in the second quarter, dropping to 23.8% of all homeowners with a mortgage from 25.4% in the first quarter of 2013. The negative equity rate has been continually falling for the past five quarters, with the second quarter of 2013 being down significantly from the second quarter of 2012 at 30.9% – a decrease of more than 7 percentage points. In the second quarter of 2013, more than 805,000 American homeowners were freed from negative equity. However, more than 12 million homeowners with a mortgage remain underwater (Figure 1). Moreover, the effective negative equity rate nationally — where the loan-to-value ratio is more than 80%, making it difficult for a homeowner to afford the down payment on another home — is 41.9% of homeowners with a mortgage. While not all of these homeowners are underwater, they have relatively little equity in their homes, and therefore selling and buying a new home while covering all of the associated costs (real estate agent fees, closing costs and a new down payment) would be difficult (Figure 2). Of all homeowners – roughly one-third of homeowners do not have a mortgage and own their homes free and clear – 16.7% are underwater.
Very high rates of home value appreciation across the nation have been the main factor reducing negative equity levels. Some of the hardest hit markets during the housing bust are now showing the highest rates of home value appreciation. These are in turn driven by high rates of negative equity. The hardest hit areas had very large drops in home values, which produced massive amounts of negative equity. With many homeowners underwater, the inventory of for-sale homes is severely limited, and we have been seeing tighter inventory that has only recently started to ease. These tight inventory levels produce bidding wars and drive up home values. Of course at the end of this cycle, higher home values work to reduce negative equity and stabilize the market.
Markets that have seen the highest levels in home value appreciation in July include Sacramento (33.1%), Las Vegas (30.8%), San Francisco (27.8%), Riverside (27.3%) and San Jose (25.1%). Furthermore, continued foreclosure liquidations are also driving down the negative equity rate. Despite these high rates of appreciation, negative equity is still very high and will remain high as deeply underwater homeowners are slowly being lifted toward positive equity. This is a process that will take several years – especially in the hardest hit markets – to work off the high levels of negative equity.
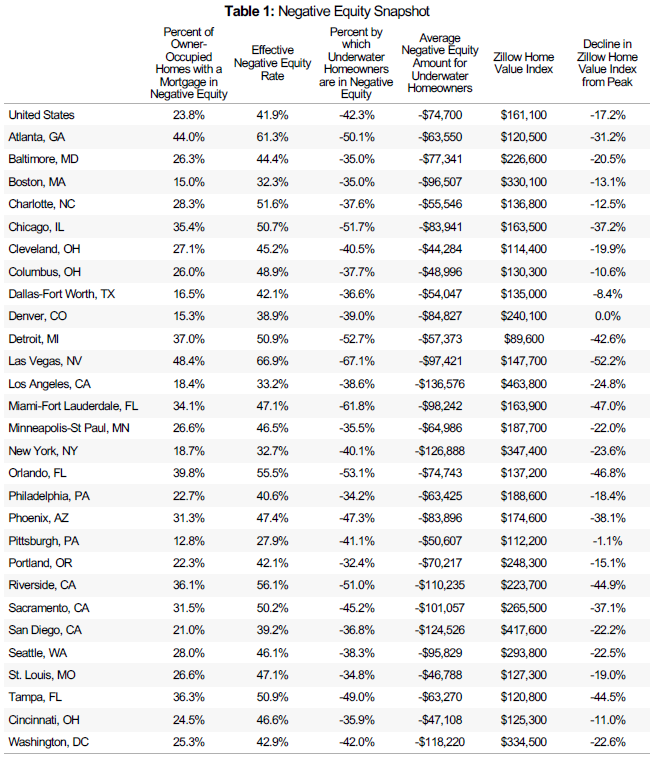
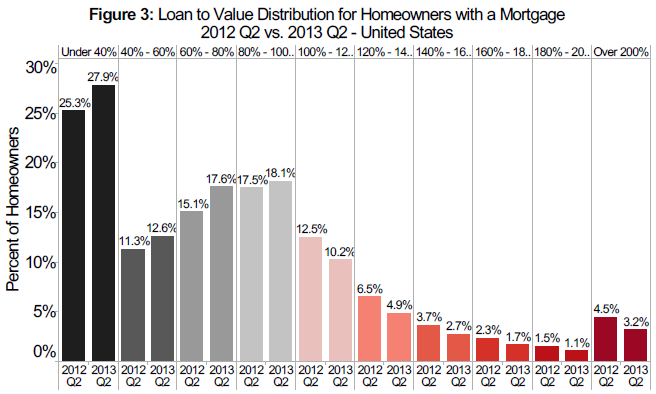
Figure 3 shows the loan-to-value (LTV) distribution for homeowners with a mortgage in the nation in 2013 Q2 vs. 2012 Q2. Even though many homeowners are still underwater and haven’t crossed the 100% LTV threshold to enter into positive equity, they are moving in the right direction. The good news is that with these high rates of appreciation negative equity has been reduced at a fast pace in the near-term (this will change as home value appreciation moderates later on this year and into the next, as the current rates are not sustainable). Over the last year Phoenix’s negative equity rate dropped by 20.4 percentage points, Las Vegas’ dropped by 20.1 percentage points and Sacramento’s dropped by 17.7 percentage points (Q2 2012-Q2 2013). However, nationally the effective negative equity rate remains very high at 41.9%. In a move-up market, homeowners with less than 20% equity will effectively still be “locked” into negative equity. On average, a U.S. homeowner in negative equity owes $74,700 more than what their house is worth, or 42.3% more than the home’s value (Table 1). While roughly a quarter of homeowners with a mortgage are underwater, 92% of these homeowners are current on their mortgages and continue to make payments.
The Zillow Negative Equity Report incorporates mortgage data from TransUnion, a global leader in credit and information management, to calculate various statistics. The report includes, but is not limited to, negative equity, loan-to-value ratios and delinquency rates. To calculate negative equity, the estimated value of a home is matched to all outstanding mortgage debt and lines of credit associated with the home, including home equity lines of credit and home equity loans. All personally identifying information (“PII”) is removed from the data by TransUnion before delivery to Zillow. Overall, this report covers more than 870 metros, 2,500 counties and 24,300 ZIP codes across the nation.
An interactive map of this data can be found here.
Regional Trends
As described earlier, home value appreciation has been the main factor driving down negative equity rates, specifically in very hard-hit states, such as California, Florida, Nevada, Arizona and Georgia. There has been a negative equity feedback loop, as regions with high negative equity have experienced acute inventory shortages brought on in part by locked-in underwater homeowners, and these shortages in turn have produced home value appreciation spikes, which have been reducing negative equity at a fast pace. The metros that have seen the largest quarterly drop in negative equity among the largest 30 metros are Sacramento (down 6 percentage points), Las Vegas (down 5.9 percentage points), Phoenix (down 4.6 percentage points), Dallas (down 4.0 percentage points) and Minneapolis (down 3.7 percentage points). Despite these large drops in negative equity, the rates remain high, especially when considering the effective negative equity rate. Table 1 shows the effective negative equity rates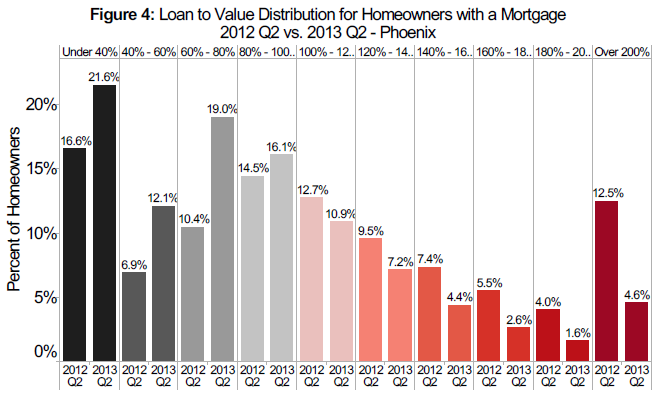 for the top 30 metros, where Las Vegas has the highest rate of 66.9%, followed by Atlanta at 6
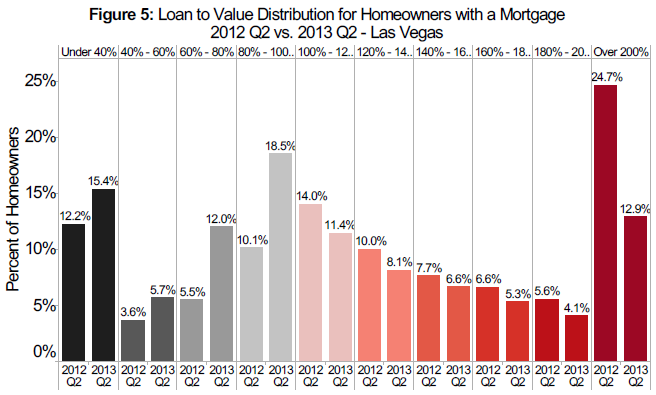 1.3% and Riverside at 56.1%.
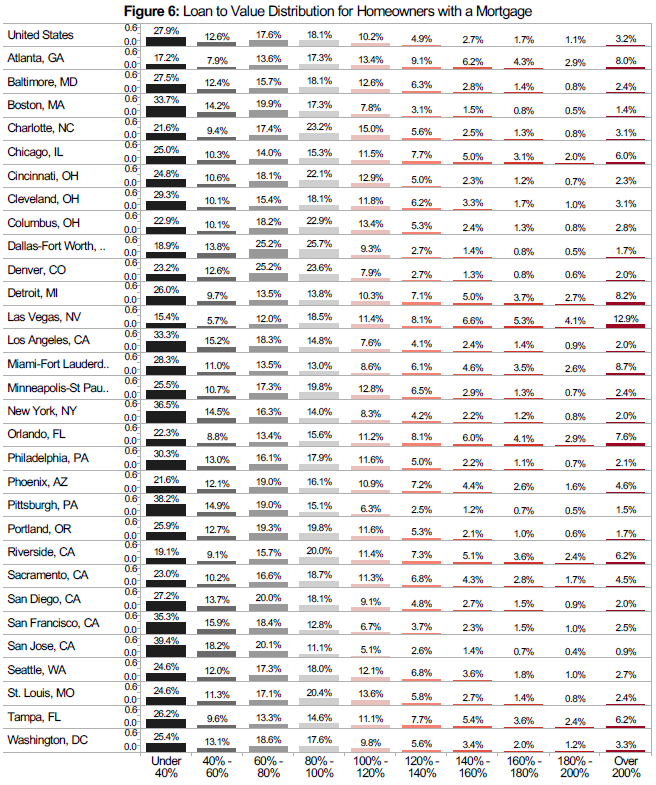
In some cases high home value appreciation rates have produced only relatively small decreases in negative equity rates. However, the depth of negative equity has been significantly impacted. In the Phoenix metro, the percentage of homeowners with a mortgage who owed more than double what their houses were worth was reduced from 12.5% to 4.6% from the second quarter of 2012 to the second quarter of 2013, which can be seen in Figure 4. In the Las Vegas metro, 12.9% of homeowners with a mortgage owe more than twice the amount of their homes’ value. This number compares favorably to how deeply underwater Las Vegas homeowners were a year ago. In 2012 Q2, 24.7% of homeowners with a mortgage owed more than double (see Figure 5). On the metro level there is wide variation in negative equity, with the percentage of underwater borrowers ranging from 0.2% to 57.1%. Furthermore, there is wide variation in how deep homeowners are underwater. Figure 6 provides an overview of the distribution of the loan-to-value ratio for the largest metropolitan areas (a loan-to-value ratio greater than 100 % means that the homeowner is underwater).
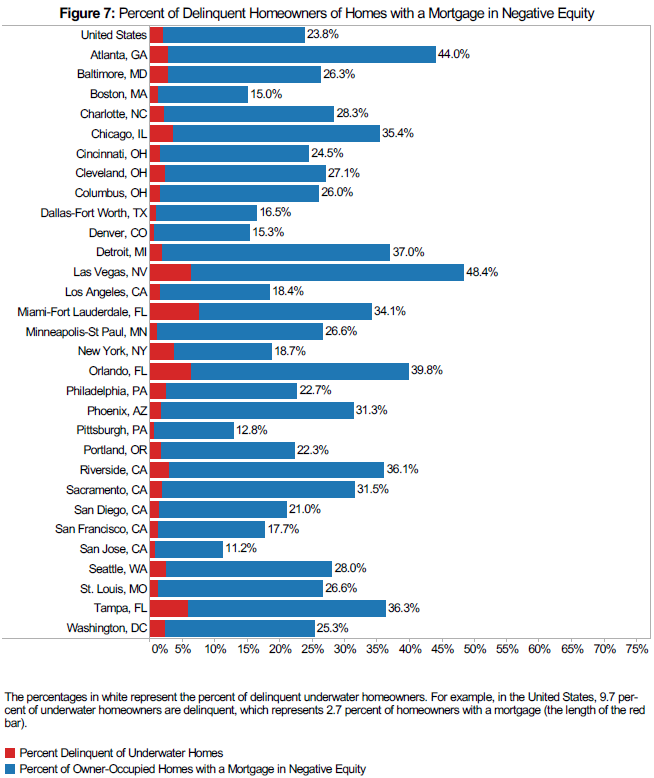
While negative equity makes a household more vulnerable to foreclosure, most homeowners in negative equity will not end up in default. The majority of underwater homeowners continue to make regular payments on their mortgages, with only 8% (down from 9.2% a year ago) of underwater homeowners being delinquent. This implies that 1.9% of all homeowners with a mortgage are at high risk for foreclosure near-term. Figure 7 shows a breakdown of these numbers for the top 30 metros.
Forecast
The Zillow Negative Equity Forecast predicts the negative equity rate among all homeowners with a mortgage will fall to at least 20.9% by the second quarter of 2014, freeing more than 1.9 million additional underwater homeowners nationwide. Of the 30 largest metro areas, the majority of these newly freed homeowners are anticipated to come from Los Angeles (89,677 homeowners), Riverside (74,054 homeowners) and Atlanta (61,186 homeowners). The Zillow Home Value Forecast is a conservative estimate of what negative equity rates will be a year from now. We do expect that the rate will break the 20% threshold by the second quarter of next year. To forecast negative equity, we take the current home value of a house and appreciate it by the Zillow Home Value Forecast (ZHVF) for the MSA in which the home is located. In cases where there is no ZHVF available, we use the historical rate of home appreciation, and for metros that don’t have a historical rate of appreciation we use the historical rate of inflation at the national level. For homes that are not located in a metropolitan area, we use the forecasted national rate of appreciation. To calculate the level of home equity a year from now, we use the forecasted home value and the current outstanding debt balance, where we make no assumptions about a homeowner’s debt level a year from now. We also make no assumptions about foreclosure activity in the coming year. Therefore, this forecast is a very conservative one, as homeowners will likely continue to pay down their debt throughout the year, and homes will likely continue to be foreclosed on, and both of these factors will contribute to a lower negative equity rate. The Zillow Negative Equity Forecast can therefore be considered a higher bound estimate of negative equity.
Outlook
Over the past year we have clearly seen the impact of negative equity on the market. We have described how negative equity limits the available for-sale inventory in the marketplace, which in turn has produced extreme rates of home value appreciation. Negative equity will continue to impact the real estate market, especially as mortgage rates rise and home value appreciation tempers. There are already cities, such as San Francisco, Denver, Boston and Washington, D.C., which have surpassed their housing bubble home value peaks and homes are now more expensive than they have ever been in these markets.
We are already seeing slowing demand for homes, and this will lead, in some markets, to stagnant home values or even home value depreciation. Once that occurs, negative equity will be reduced at a much slower pace and might even increase again. We expect these dynamics to unfold two to three years from now once mortgage rates are again closer to more normal levels. We expect the 30-year fixed mortgage rate to reach 5 percent by the middle of 2014. In the short term, home values are up 6% on a year-over-year basis in July 2013, and given our forecast of an additional 4.8% home value appreciation over the next year (July 2013 to July 2014), we expect that negative equity rates will continue to decrease in the next year to a rate of, at most, 20.9% by the first quarter of 2014.
To download Zillow Negative Equity data, visit our data page at http://www.zillow.com/research/data/.