Zillow’s monthly forecast of new single-family homes is based on the results of two models:
- A “historical” model that estimates new home sales as a function of past movements in new home sales and recent housing starts data.
- A “structural” model that estimates home sales as a function of other economic variables.
While the historical model tends to be more accurate, the structural model provides greater insight to the underlying drivers of new home sales.
The Historical Model 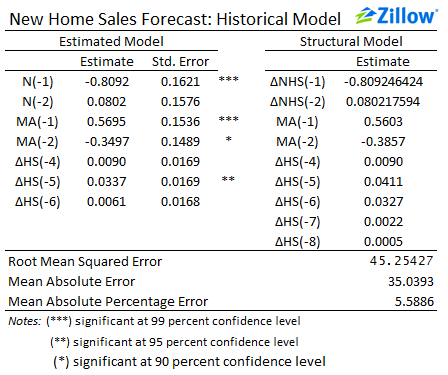
The historical model uses past new home sales data as well as past values of housing starts. We model the number of new home sales in each month from January 1963 to June 2014 as an ARIMA(2,1,2) process, with three lags of housing starts as external regressors—from four, five and six months prior (figure to the right).
In 2013, it took an average of five months to complete construction of a new home, from start to finish, according to the U.S. Census Bureau’s Survey of Construction. We use this observation as a starting point for lag length selection for housing starts. Choosing four, five and six month lags of housing starts minimized the Akaike and Bayesian information criteria among various combinations of two to six lags tested. When housing starts increase between four and six months previous, new home sales can be expected to increase during the subsequent months, with houses started five months ago having the largest effect. New home sales can also be expected to increase in a given month when sales increase two months prior, but are expected to decrease when sales in the previous month increased.
The Structural Model 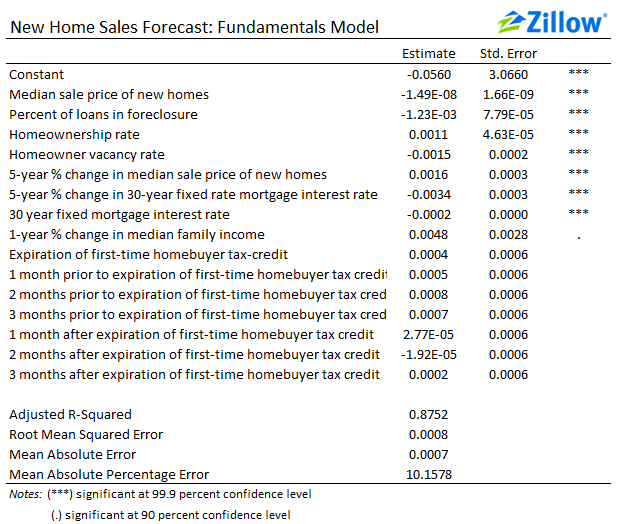
The structural model is similar to the historical model Zillow uses to forecast existing home sales, but includes several additional variables:
- The share of loans in foreclosure at the end of the quarter (monthly interpolated series), published by the Mortgage Bankers Association (MBA) National Delinquency Survey.
- The median sales price of new single-family homes, published by the Census Bureau.
The inclusion of the share of loans in foreclosure is particularly important, since foreclosure re-sales and new homes are often substitutes in the eyes of homebuyers. The data cover April 1976 to June 2014 (figure to the right).
