Stage Set for Unseasonably Warm Winter Housing Market (November 2021 Market Report)
Home value growth is trending up in most large markets while inventory is trending down, suggesting a more competitive market is in the cards this winter.

Home value growth is trending up in most large markets while inventory is trending down, suggesting a more competitive market is in the cards this winter.
The usual spring thaw in the housing market may come much earlier than usual, according to the Zillow November Market Report. Home value growth is trending up in most large markets while inventory is trending down, suggesting a more competitive market is in the cards this winter.
The Zillow Home Value Index (ZHVI) rose 1.2% from October, to $316,368, up 19.3% from November 2020 level. The annual growth represents an all-time high in data dating back more than 20 years, and the monthly pace is higher than at any point recorded prior to the pandemic — though still down notably from the all-time high of 2% set in July. Monthly growth has been falling since mid-summer but barely slowed at all in November from October’s 1.3% pace. If current trends continue, monthly growth could plateau near the current pace, translating to an annualized growth rate of 14% – slower than today, but still historically very strong.
This slowdown of the slowdown extended to local markets, too. Monthly home value growth did slow from October to November in 20 of the nation’s 50 largest metro markets – down from 41 that experienced slowdowns in October from September. Put another way, while a majority of the nation’s biggest markets experienced a month-month slowdown in October, a majority experienced an acceleration in November. The slowest monthly growth in November was in Milwaukee (0.3%), followed by Pittsburgh (0.3%), Detroit (0.5%), Buffalo (0.5%) and Sacramento (0.5%). The fastest was in Nashville (2.6%), Orlando (2.4%) and Atlanta (2.3%).
Likely related to the re-acceleration in growth in many areas, the level of active inventory fell 6.1% in November from October, leaving the number of active listings down 17.5% from November 2020. All else equal, a lower level of inventory both leaves buyers with fewer options and means less competition for any given seller. And the annual decline understates just how abnormally low inventory really is after almost two years of near-constant declines. Compared to a more “normal,” pre-pandemic period in November 2019, there are now 37.8% fewer homes available for sale. By that 2-year comparison metric, the normalizing trend in inventory over late summer and early fall has in fact begun to slide into reverse.
Inventory’s stalled-out rebound is even more striking in light of the near-complete expiration of mortgage forbearance, which some (Zillow included) speculated may trigger a wave of forced listings this autumn. It is still possible that some distressed homeowners may list their homes for sale later this winter if they are unable to reach repayment agreements with their lenders. But so far, it appears the forbearance program was largely successful in achieving its goal of keeping people in their homes and avoiding the wave of foreclosures and distressed sales that characterized the 2008-2012 era housing market.
Inventory was down in November from October in at least 49 of the nation’s 50 largest metros (monthly data for Nashville is unavailable), and was down year-over-year in 46 of the 48 largest metros for which full data is available (November 2020 data for Milwaukee and Nashville is unavailable). The largest annual inventory declines in November among the largest 50 markets were in Miami (-45.8%), Raleigh (-39.6%) and Denver (-38.9%). Inventory was up year-over-year in Austin (+18.6%) and Washington, D.C. (+2.1%).
If there is one small silver lining for frenzied would-be homebuyers contending with rapid home value appreciation and limited inventory, it may be that the speed of the market has gradually slowed down since reaching a peak early in the summer. In June, the typical U.S. home spent just one week on the market before going under agreement. That time frame has risen every month since, to roughly 12 days in November (up from about 11 in October). Homes staying on the market less than two weeks before selling is still incredibly fast, but those extra few days may matter a lot to those buyers that need a little more time to assess their options.
The Zillow Observed Rent Index rose a record 15.2% year-over-year in November, to $1,867/month. But similar to home value growth, the monthly and annual pictures are different. Rents rose 0.9% in November from October, a modest slowdown from 1.0% monthly appreciation in October.
Rents grew year-over-year in all 50 of the nation’s largest metros. Annual rent appreciation was fastest across the Sunbelt, with the fastest growth in Tampa (28.4%), Miami (27.3%), Phoenix (26.5%) and Las Vegas (25.3%). Among the 50 largest metros, annual rent growth was slowest in Minneapolis (5.4%), Milwaukee (6.9%) and Louisville (7.9%).
The rapid growth in rents is now being picked up, after a delay earlier this year, in official measures of inflation. The main Consumer Price Index component measuring rents, the Rent of Primary Residence, rose 3.0% year-over-year in November, or almost 0.5% month-over-month. Combined with rising Owners’ Equivalent Rent, which was also up over 0.4% in November, the rising shelter components of the CPI are contributing to overall inflation – now registering its fastest growth in over 30 years.
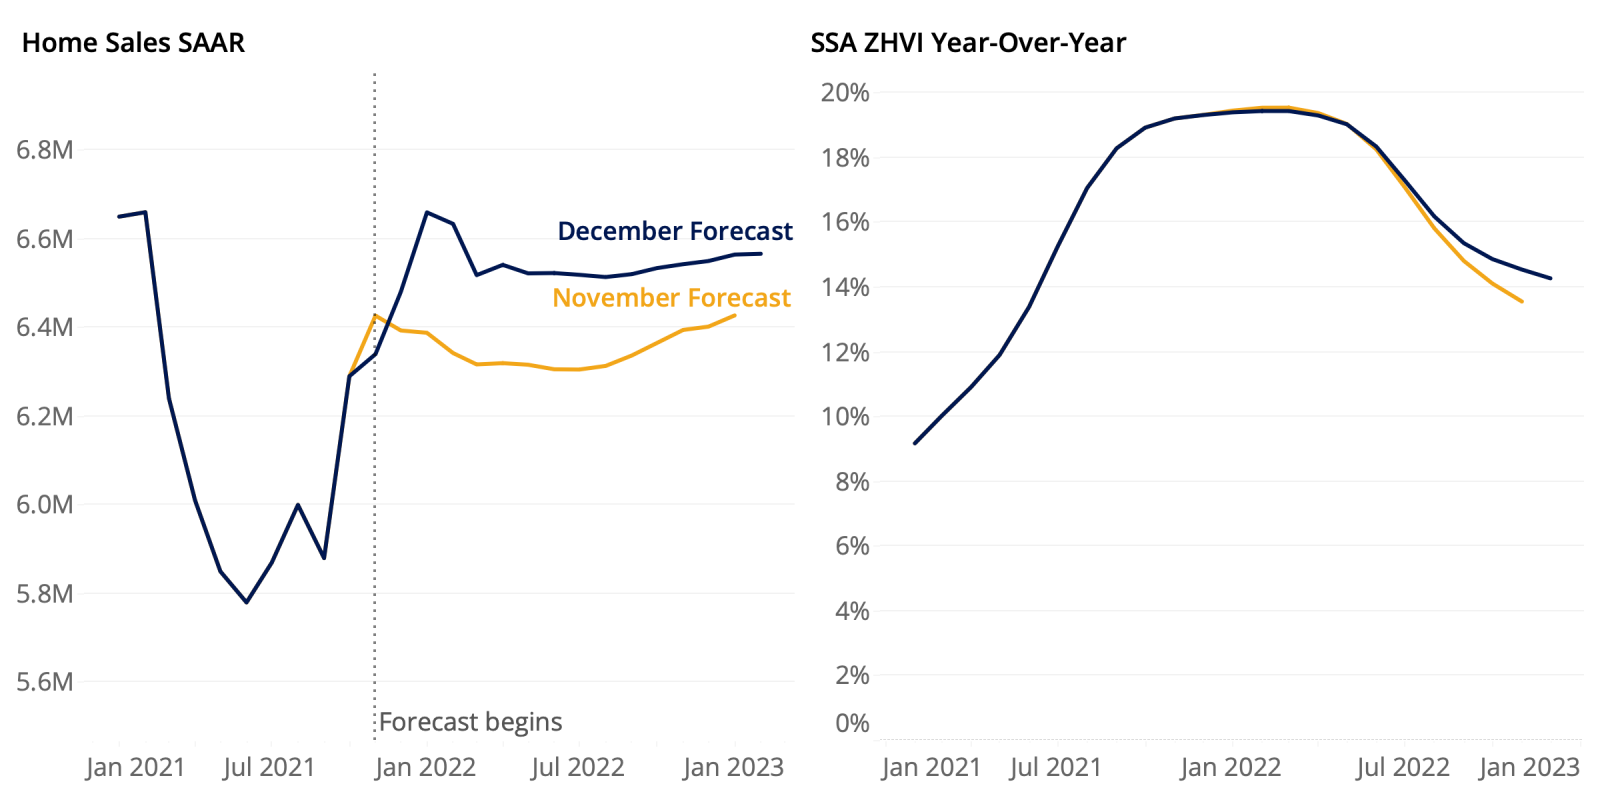
Existing home sales are expected to end 2021 up strongly from 2020, and only continue growing through 2022, while annual home value growth is likely to peak and plateau in the early months of 2022 before slowing somewhat through the end of next year.
Home values are expected to grow 3.7% in the three month period from November to February 2022, and to end 2021 up 19.4% from the end of 2020. The near-term, three-month forecast is largely unchanged from 3.8% growth expected previously from October to January. Over the longer-term, however, our expectations for home value growth have risen: We expect home values to grow 14.3% over the 12 months ending November 2022, up from 13.6% growth over the twelve months ending October 2022 that we projected last month. The robust long-term outlook is driven by our expectations for tight market conditions to persist, with demand for housing exceeding the supply of available homes.
We currently expect 6.13 million existing home sales to close in 2021, up 8.6% from 2020 and also up slightly from our previous forecast of 6.12 million sales this year. Existing home sales volume rose to 6.34 million (SAAR) in October – up 0.8% from September, which was also unexpectedly strong. This better-than-expected showing is the main contributor to the upward revision in our near-term outlook for the series. Sales are expected to continue growing in 2022, forecasted to finish next year with more than 6.5 million closed existing home sales, up 6.5% from 2021.
However, downside risks to our forecast remain. The expiration of mortgage forbearance programs adds uncertainty to the outlook for for-sale inventory, and elevated inflation heightens the risk of near-term monetary policy tightening, which would result in higher mortgage rates and weigh on housing demand.
