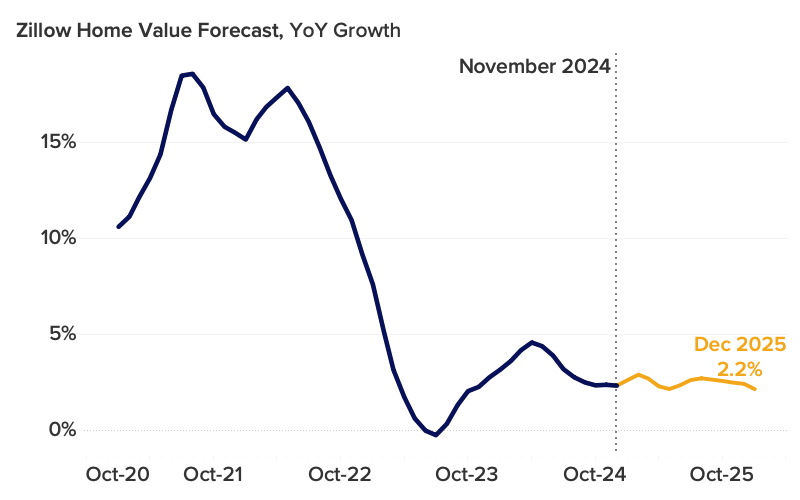
Erratic and dramatic mortgage rate movements that heavily influenced the housing market in 2024 are destined to play a major role once again in the coming year. Zillow’s latest forecast outlines slowly declining mortgage rates in 2025, setting the stage for modest growth in both sales and home price appreciation.
A late-summer dip in rates gave a second-half tailwind to this year’s home sales as buyers and sellers took advantage — Zillow expects 4.06 million sales for 2024. That number should rise slightly to 4.16 million in 2025, according to Zillow’s forecast. Home values are forecast to tick up 2.2% over the course of 2025, right in line with the 2.3% annual appreciation observed in November.
Along with home price appreciation that has flattened out nationwide after the wild swings of the past five years, other measures of the market are coming closer to historical norms.
The flow of new listings to the market is still nearly 14% lower than it was before the pandemic, but that’s great progress over March’s 25% deficit.
Total for-sale inventory is similarly clawing its way out of a deep hole that developed early in the pandemic. It is now about 26% below the norms of 2018 and 2019, the smallest shortfall seen since September 2020. Both of these should continue to improve next year, but again, progress will depend heavily on what happens with rates.
Shoppers looking for homes during the slower winter months may have an opportunity to snag a deal in a market that’s becoming increasingly buyer-friendly. Zillow’s market heat index shows competition for homes cooled nationwide and in 36 of 50 major U.S. metro areas from October to November.
While the number of options available to shoppers today is lower than they will likely see in the spring, there’s also less competition in the field. The share of homes that sold for more than list price was below 28% in October (the latest data available), continuing a downward trend that began in July.
Compared to the spring rush, buyers in the market this winter should have an easier time negotiating from a position of safety, with a greater chance to buy contingent on inspections or repairs and a lesser chance of being drawn into a bidding war.
Home values
- The typical U.S. home value is $358,761.
- The typical monthly mortgage payment, assuming 20% down, is $1,865. That’s down 3.8% from last year but 111.2% higher than before the pandemic.
- Home values climbed month over month in one of the 50 largest metro areas in November — San Jose, where they rose 0.3%. Louisville and Salt Lake City held steady while Washington (-0.1%), and New York (-0.1%) had the smallest declines.
- Home values fell, on a monthly basis, in 47 major metro areas. The largest monthly drops were in Austin (-1.1%), Tampa (-0.9%), San Antonio (-0.8%), Dallas (-0.8%), and Buffalo (-0.7%).
- Home values are up from year-ago levels in 42 of the 50 largest metro areas. Annual price gains are highest in San Jose (7.5%), New York (7%), Providence (6.7%), Hartford (6.7%), and Cleveland (5.9%).
- Home values are down from year-ago levels in seven major metro areas. The largest drops were in Austin (-3.4%), San Antonio (-2.4%), Tampa (-1.9%), New Orleans (-1.9%), and Jacksonville (-0.7%).
Inventory and new listings
- New listings decreased by 21.6% month over month in November.
- New listings increased by 0.6% this month compared to last year.
- New listings are 13.5% lower than pre-pandemic levels.
- Total inventory (the number of listings active at any time during the month) in November decreased by 6.3% from last month.
- The median age of inventory, the typical time since the initial list date for active for-sale listings, was 70 days. That’s 14 days more than last year, but 10 fewer than before the pandemic.
- There were 17.2% more listings active in November compared to last year.
- Inventory levels are -26.3% lower than pre-pandemic levels for the month.
Price cuts and share sold above list
- 21.8% of listings in November had a price cut. That is down 3ppts month over month.
- There are 0.7ppts fewer listings with a price cut compared to last year.
- 27.8% of homes sold above their list price last month. That is down 0.9ppts month over month.
- 3.9ppts fewer homes sold above their list price compared to last year.
Newly pending sales
- Newly pending listings decreased by 16.6% in November from the prior month.
- Newly pending listings increased by 6.9% from last year.
- Median days to pending, the typical time since initial list date for homes that went under contract in a month, is at 28 days in November, up 5 days since last month.
- Median days to pending increased by 7 days from last year.
Market heat index
- Zillow’s market heat index shows the nation is currently a neutral market.
- The strongest sellers markets in the country are San Jose, Hartford, Buffalo, New York, and Boston.
- The strongest buyers markets in the country are New Orleans, Miami, Jacksonville, Indianapolis, and Louisville.
