Zillow expects new home sales for October to fall between 0.4 percent and 2.5 percent month-over-month, to between 455,000 and 465,000 units at a seasonally adjusted annual rate (SAAR) from 467,000 units in September. However, the models we use and the underlying assumptions are not always as definitive as we would like. Below we provide greater detail about the assumptions used in our October forecast.
Zillow’s new home sales forecast uses two models:
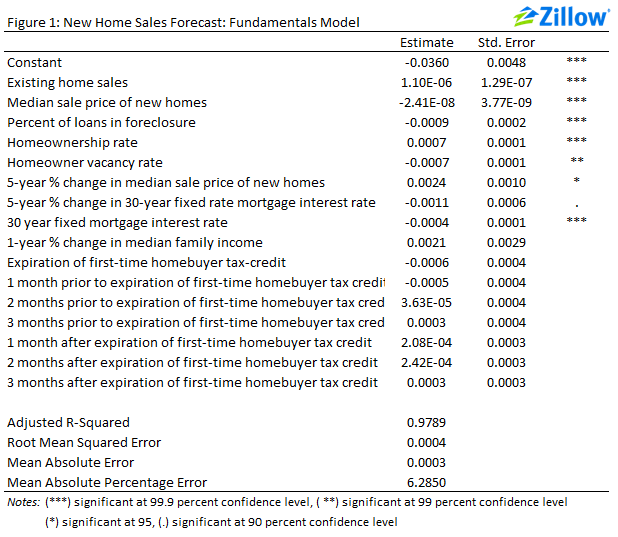
- A “structural” model that estimates new home sales as a function of other economic data.
- A “historical” model that estimates new home sales as a function of past movements in new home sales as well as recent housing starts.
More information about these two models can be found here.
The historical model considers past values of new home sales and housing starts when estimating new sales for the current month. New home sales are expected to increase when new home sales increase two months prior, but decrease when new home sales increase in the previous month. New home sales are also expected to increase when housing starts pick up within the past six months.
For October, our historical model suggests that new home sales will fall 1.9 percent to 458,000 units (SAAR). The decline is driven largely by the fall in month-over-month housing starts recorded in May 2014, which has the largest negative effect on the overall forecast, outweighing the 15 percent month-over-month increase in new home sales in August 2014.
The structural model typically provides greater insight than the historical model into the broader economic forces that drive new home sales. Depending on the month, it can rely heavily on forecasts of explanatory variables. In particular, our forecasts of the homeownership rate, homeowner vacancy rate and the percent of loans in foreclosure—which we must forecast one to four months ahead because they are only released quarterly—can have large effects on the model estimates. For October, we only need to forecast these variables one month ahead, because they were last released in September.
An additional variable was added to the structural model this month. Since January 1999, the correlation of existing home sales and new home sales is 0.89, a very high correlation coefficient. The coefficient on existing home sales in the re-estimated model is significant at the 99.9 percent confidence level (figure 1), suggesting that existing home sales is a strong predictor of new home sales. This month we used October’s existing home sales figure of 5.26 million units (SAAR), released November 20.
The homeownership rate has been declining steadily. Our baseline forecast assumes that the homeownership rate continued its recent decline last month, although at a slower pace, falling 0.1 percentage point in October. However, if it continued to decline at its recent pace of 0.3 percentage points per month, then new home sales would fall to 449,000 units (SAAR), down 4.9 percent from September.
The homeowner vacancy rate had been falling steadily throughout the recovery, but the most recent data show a slight increase, in line with Zillow’s for-sale inventory series. Holding all else constant, if the homeowner vacancy rate were to increase in October from 1.75 to 1.80, in line with recent months, then new home sales would decline by 1.3 percent to 461,0000 units (SAAR).
The percent of loans in foreclosure has also been falling steadily, beginning in early 2012. However, a best-fit ARIMA model, an ARIMA(3,1,4) in this case, suggests a slight increase of 0.02 percentage points, to 2.41 percent. If this increase is accurate, then new home sales would fall to 446,000 units (SAAR), a decline of 4.5 percent.
Our model is less sensitive to other assumptions, including:
- We estimate that the median sale price of new homes sold in October will increase to $271,500—the result of a best-fit ARIMA model, ARIMA(1,1,1) process in this case—from $256,500 in September, which is still below the $287,000 level recorded in August.
- We estimate median family income will increase to $66,500, from $66,300 in June 2014, in line with the change in the Consumer Price Index (CPI) for Services.
- We expect the number of U.S. households will increase to 115.9 million in October, up from 115.8 million in September, the result of a best-fit ARIMA model (ARIMA(3,1,0) process, in this case).
