Home Price Plateau Continued in October While Rising Interest Rates Chilled Sales (October 2022 Market Report)
Home values inched up 0.1% in October, as tight inventory kept pricing surprisingly resilient. Still, this flicker of demand strength might be a belated response to the late-summer drop in mortgage rates, to an average of 5.22% in August on a 30-year fixed loan, which gave some buyers a reason to jump off the fence and buy then.
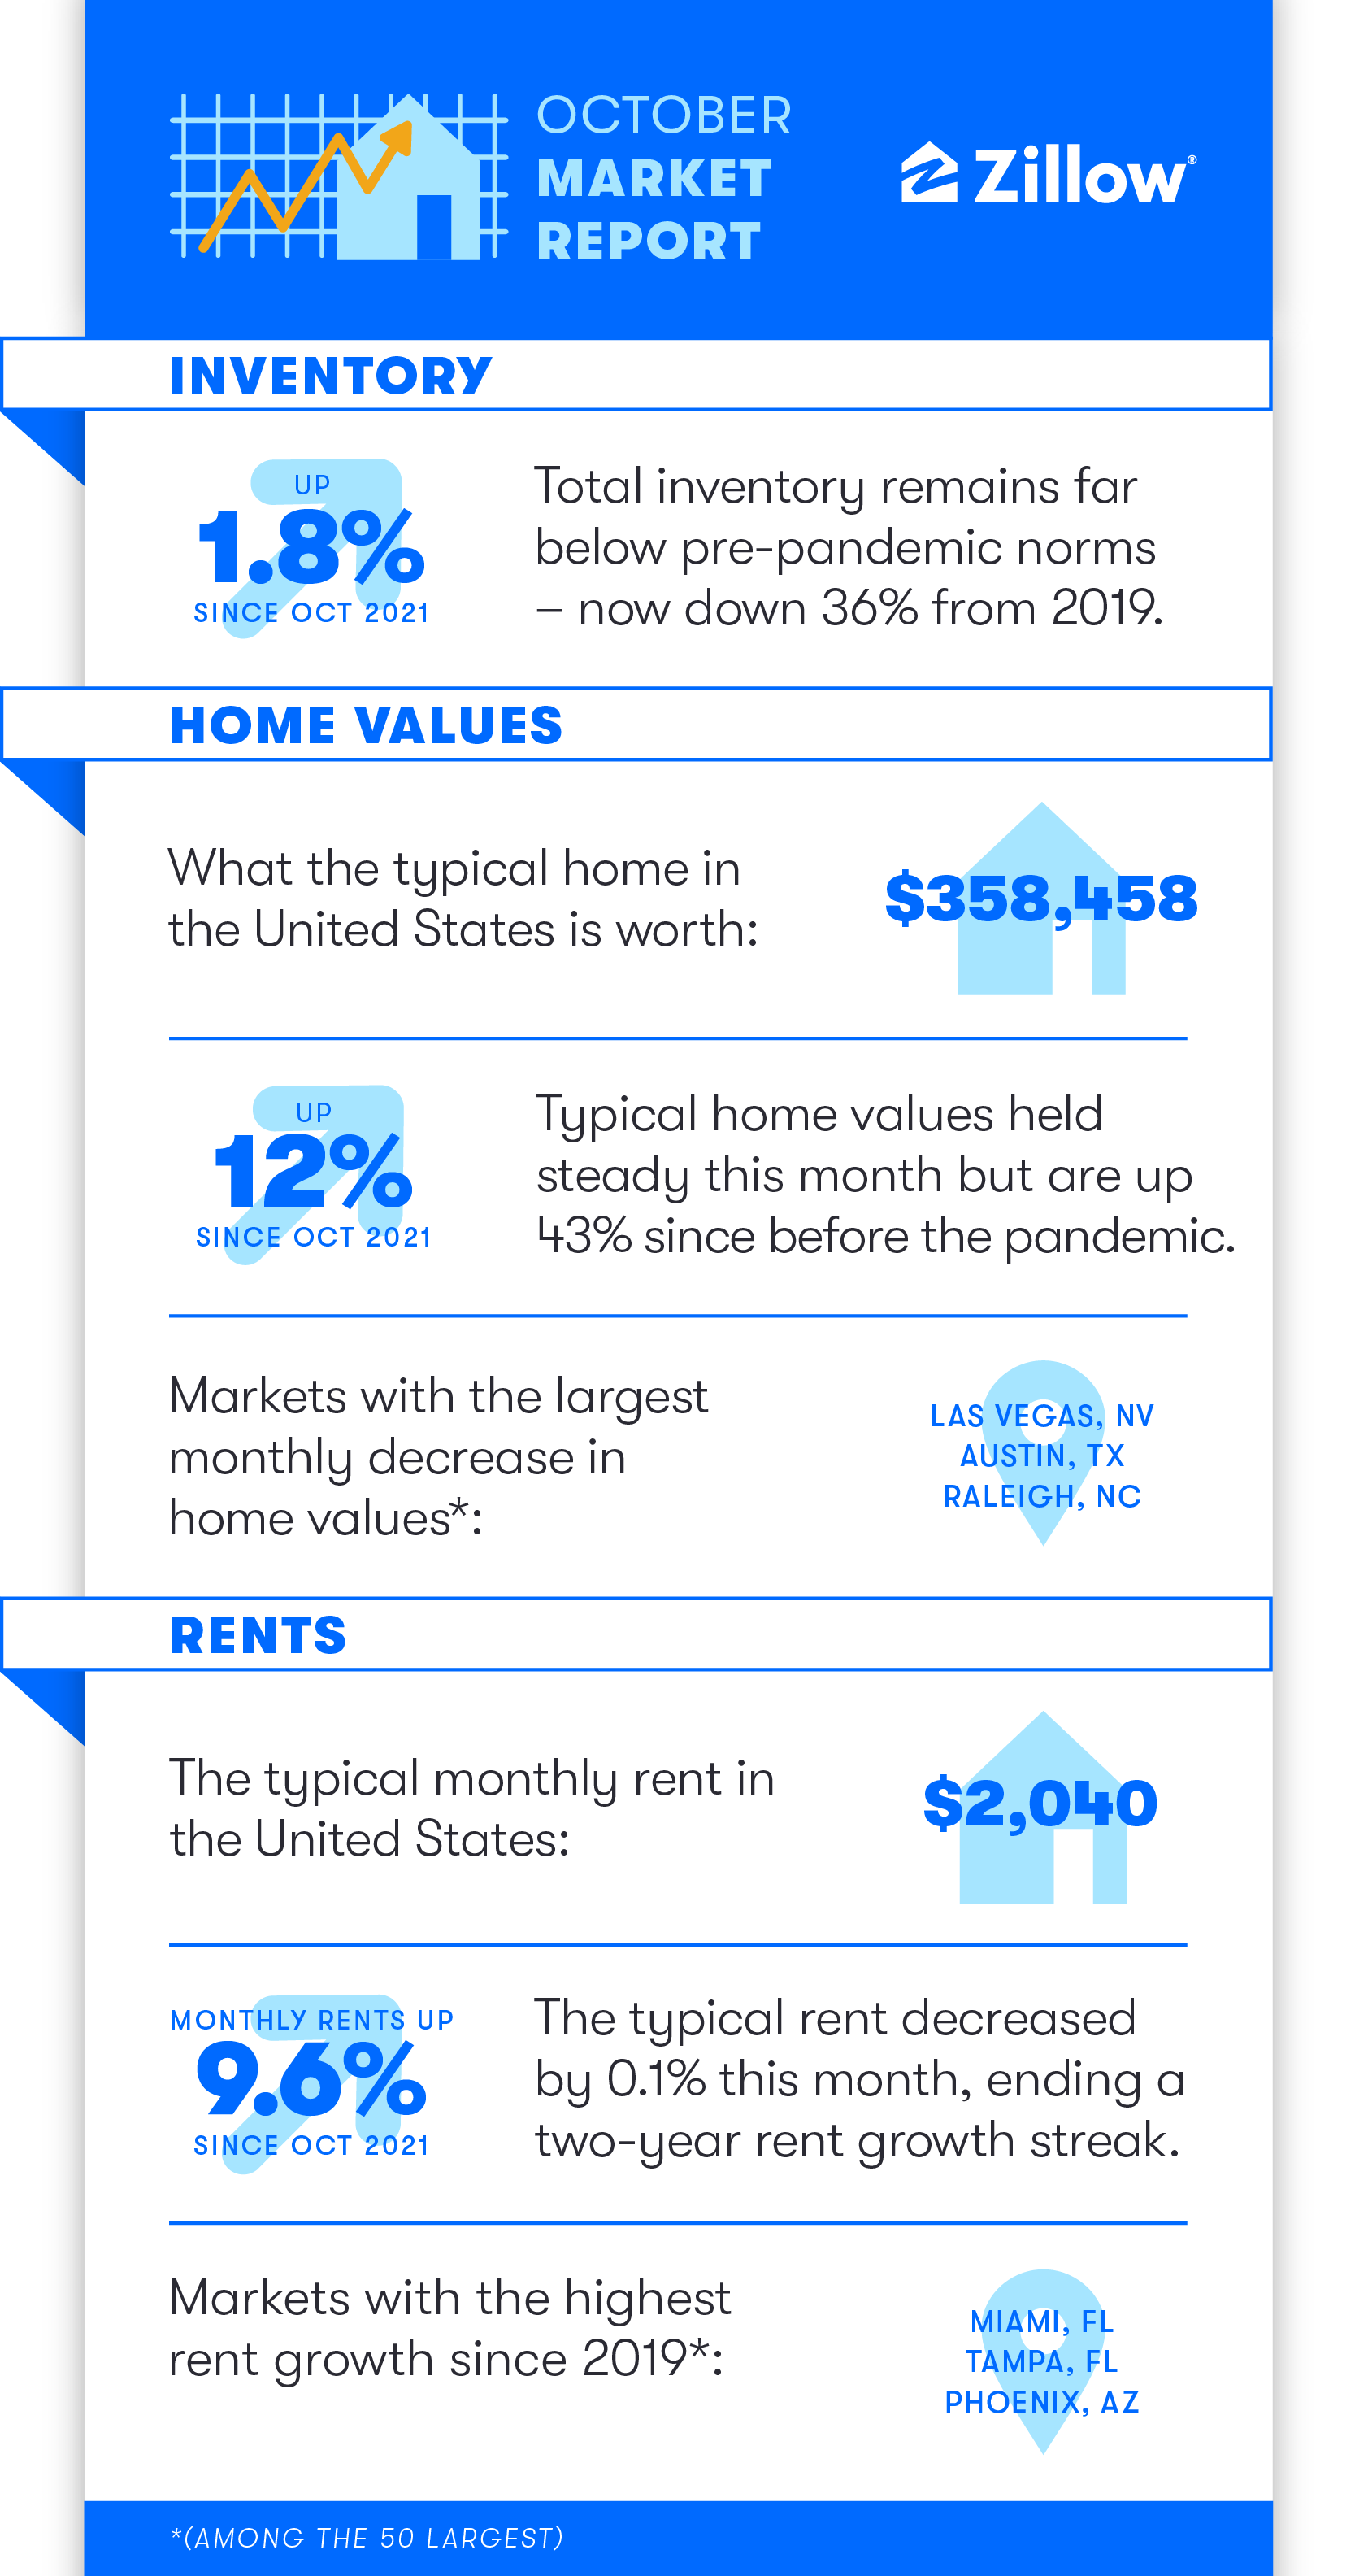
- The typical U.S. home value climbed 0.1% in October from September
- The number of newly pending listings in October dropped a whopping 35.1% compared to last October.
- Active inventory’s rebound stalled out at a mere 1.8% year-over-year increase in October.
- Rising mortgage rates continued to put pressure on buyers’ budgets.
Home values inched up 0.1% in October, as tight inventory kept pricing surprisingly resilient. Still, this flicker of demand strength might be a belated response to the late-summer drop in mortgage rates, to an average of 5.22% in August on a 30-year fixed loan, which gave some buyers a reason to jump off the fence and buy then. Due to the multiple weeks between home purchase offers being made and the transactions closing, August’s more favorable lending conditions likely still affected some closed sale prices in October. Unfortunately for buyers, rates have risen dramatically since August, surpassing 7% for the first time in 20 years, and promising continued cooler demand this winter.
While national prices held steady, the tumble continued in many formerly-hot housing markets. The largest monthly declines were in Las Vegas (-2.3%), Austin (-2.2%), and Raleigh (-1.1%). Meanwhile, prices continued to rise in more affordable metro areas, led by the Milwaukee (0.9%), Hartford (0.9%), and Kansas City (0.8%) markets. Surprisingly, some expensive Western markets including Los Angeles (+0.8%) and Riverside (+0.4%) abruptly snapped steep value-losing streaks; time will tell if September marked the bottom for price declines in these cities.
Taking stock of changes over the last 12 months, a much different picture comes into focus: All four of the major markets with the greatest year-over-year home value appreciation are in Florida: Miami (23.3%), Tampa (21.2%), Orlando (20.9%), and Jacksonville (19.8%). At the other extreme are markets where prices are practically flat from this time last year: San Francisco (1.9%), Austin (2.3%), and Pittsburgh (3.4%) had the lowest annual home value growth among the 50 largest metropolitan areas. Among the top 100, just one market was lower: Boise, where home values are now 4.2% lower than this time last year.
Sellers and buyers are both digging in their heels to sit out this market cooldown
While sellers began backing away from the market as early as July, they have only gotten more reluctant to list in the ensuing months. Only about 313,000 new listings hit the market in October, or 24% fewer than last October.
But if sellers have gotten shy, buyers have practically gone into hibernation. Newly pending listings, a reliable leading indicator for soon-to-be-closed sales, fell a whopping 35.1% from last year. Zillow’s “nowcast” of existing home sales is projecting a year-over-year decline of 24% for closed October sales, leaving them 19% below even the volume seen in October 2019. And those lucky sellers who accepted an offer had to sweat through 18 days on the market first, at the median, compared to a mere 10 days’ turnaround from listed to pending last October.
Affordability is the biggest stumbling block for buyers. A monthly mortgage payment on a purchase of a typical house in the U.S., even when putting 20% down, was $1,910 in October. That’s a 77% jump year over year and a 107% increase – nearly $1,000 – from 2019. Monthly payment figures are even higher when using the more common 5% down payment, and when including taxes and insurance.
The share of income spent on monthly mortgage payments has risen from 27.7% in February to 37.3% in October – well above a previous peak of 35% in 2006. Housing payments are considered to be a financial burden when they exceed 30% of a household’s income.
Zillow’s tally of active inventory – the number of homes actively listed for sale at any point in the month of October – barely budged down from September’s level of 1.06 million to 1.04 million. That leaves inventory 1.8% higher than the same time last year, but still 36.1% lower than in October 2019.
Rent cooldown continues
The Zillow Observed Rent Index showed a slight 0.1% decrease from September to October, ending a two-year rent growth streak. The decline is a small step toward normalcy – harkening back to October declines seen from 2017 through 2020. Typical U.S. rent is now $2,040, up 9.6% since last October and nearly 27% since 2019.

