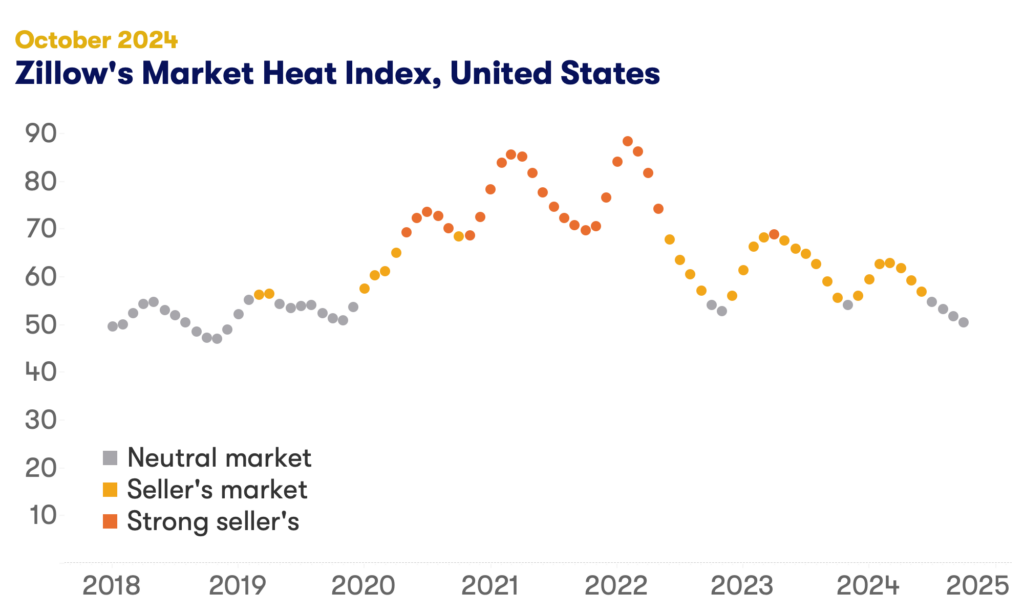
Home buyers are gaining leverage in negotiations across the U.S. as competition over homes eased in October. Zillow’s market heat index shows competition nationwide remains in neutral, balanced territory, but is creeping closer to becoming a buyers market as the shopping season winds down.
Mortgage rates that bounced up again from September lows and climbed back toward 7% in October are a major reason why competition among buyers is falling, along with the normal seasonal cooling of the housing market. But inventory that continues to recover from a pandemic-era deficit is another big contributing factor.
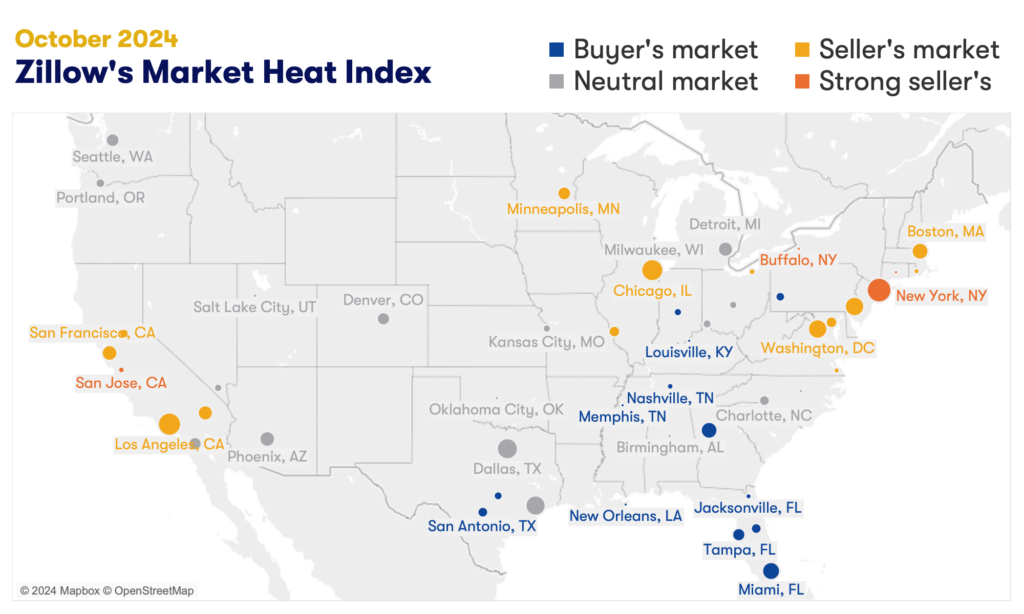
Unlike mortgage rates and holiday-style seasonality, which tend to be less regionally-focused, both seasonal inventory trends and the recovery of inventory from record lows during the pandemic are local. For example, the moving decisions of buyers and sellers may not be as hampered by winter weather in Southern states. Even more of a differentiator is the inventory recovery in the South and select other areas that helped push the scales of competition in favor of buyers by leaps and bounds for many major metro areas there – most prominently in Texas, Florida, and New Orleans.
But Zillow’s latest market report shows buyers even further afield are enjoying some time in the driver’s seat. Pittsburgh and Louisville joined 11 other major metros where buyers have an edge over sellers in negotiations in October. That comes on the heels of Indianapolis, Nashville and Atlanta becoming buyers markets in September.
With today’s persistently high home prices and mortgage environment, competition between buyers has a lot to do with available inventory. All of 13 major markets where buyers currently have an edge are among the top-20 nationwide in terms of inventory recovery compared to pre-pandemic.
In turn, that reduced competition translates to softer home value appreciation. Monthly drops in home values are the largest in Austin, Dallas, Atlanta, Tampa and San Antonio.
New construction is another piece of the puzzle here. Where builders have been better able to keep up with housing demand, balance is returning to markets sooner and affordability — down payment and rent affordability in particular — is improving.
Mortgage rate relief in September short-lived
Relief that home buyers felt in September from a dip in mortgage rates was short-lived. Rates ticked back up in October, giving back some affordability gains. Mortgage payments on a typical home purchase rose 2.8% month-over-month in October, after falling for four consecutive months. Still, monthly mortgage payments (using a 20% down payment) are down more than $100 per month compared to the peak in May and are $179 less than October of last year.
Home values
- The typical U.S. home value is $360,385.
- The typical monthly mortgage payment, assuming 20% down, is $1,802.The typical mortgage payment is down 9% from last year and has increased by 102.9% since pre-pandemic.
- Home values fell, on a monthly basis, in 47 major metro areas. The largest monthly drops were in Austin (-1%), Tampa (-0.7%), San Antonio (-0.7%), Dallas (-0.7%), and Atlanta (-0.7%).
- Home values climbed month over month in just one of the 50 largest metro areas in October: the New York City metro area (0.1%). Home values were neutral in Salt Lake City and Washington, D.C., and declines were smallest in Las Vegas (-0.1%) and Louisville (-0.1%).
- Home values are up from year-ago levels in 42 of the 50 largest metro areas. Annual price gains are highest in San Jose (7.1%), the New York City metro area (7%), Hartford (7%), Providence (6.8%), and Cleveland (5.7%).
- Home values are down from year-ago levels in seven major metro areas. The largest drops were in Austin (-3.5%), New Orleans (-3.2%), San Antonio (-2.5%), Tampa (-1.2%), and Jacksonville (-0.4%).
Inventory and new listings
- New listings decreased by 1.6% month over month in October.
- New listings increased by 2% this month compared to last year.
- New listings are 17.7% lower than pre-pandemic levels, losing some of the progress made in September.
- Total inventory (the number of listings active at any time during the month) in October fell only slightly from September, down 0.05%.
- There were 18.5% more listings active in October compared to last year.
- Inventory levels are 27.9% lower than pre-pandemic levels for the month, continuing progress on reducing the pandemic-era deficit.
Price cuts and share sold above list
- 24.8% of listings in October had a price cut. That’s compared to 25% in September and 25.1% in October of last year.
- 28.7% of homes sold above their list price in September. That’s compared to 31% in August, and down 5.1 percentage points (ppts) compared to last year.
Newly pending sales and days to pending
- Newly pending sales increased by 0.6% in October from the prior month.
- Newly pending sales increased by 7.8% from last year.
- Median days to pending, the typical time since initial list date for homes that went under contract in a month, was at 23 days in October, up two days since last month.
- Median days to pending increased by seven days from last year.
Market heat index
- Zillow’s market heat index shows the nation is currently a neutral market.
- The strongest sellers markets in the country are Hartford, San Jose, Buffalo, New York, and Boston.
- The strongest buyers markets in the country are New Orleans, Miami, Jacksonville, Memphis, and Tampa.
Rents
- Asking rents decreased by 0.2% month over month in October, slightly faster than the 0.1% decline that was the pre-pandemic average for this time of year.
- Rents are now up 3.3% from last year.
- Rents fell, on a monthly basis, in 33 major metro areas. The largest monthly drops were in San Antonio (-1.1%), Denver (-1.1%), Austin (-1%), Richmond (-0.9%), and Salt Lake City (-0.7%).
- Rents are up from year-ago levels in 48 of the 50 largest metro areas. Annual rent increases were highest in Hartford (7.2%), Cleveland (7%), Louisville (6.4%), Providence (5.8%), and Cincinnati (5.7%).
- See the full Zillow Rental Market Report for October.
