Executive Summary
A global pandemic, historic economic change and an unprecedented shift in the housing market have been hallmarks of the past year. But while these large-scale changes have shifted the landscape and have the potential to reshape buyers’ preferences over the longer term, many behaviors and attitudes remain the same.
The 2022 Consumer Housing Trends Report (CHTR) provides a snapshot of what housing consumers are thinking and doing in mid-2022. In this report, we take a deeper look at prospective buyers (household decision makers who intend to buy a new home in the next year); In other reports, we examine renters, sellers, and successful buyers more closely. Information about the actions, challenges and preferences of prospective buyers can equip consumers with the tools they need to make informed decisions in this transforming housing market landscape.
Survey Methodology
Research Approach
In order to gain a comprehensive understanding of U.S. prospective buyers, Zillow Group Population Science conducted a nationally representative survey of more than 7,100 prospective buyers. The study was fielded between March and July 2022.
For the purpose of this study, “prospective buyers” refers to household decision makers 18 years of age or older who said that they intended to buy a home in the next 12 months.
Sampling & Weighting
Results from this survey are nationally representative of buyers. To achieve representativeness, ZG Population Science used a two-prong approach. First, the initial recruitment to the sample was balanced to all buyers from the U.S. Census Bureau, 2019 American Community Survey (ACS) on the basis of age, relationship status, income, ethnicity/race, education, region and sex. Additional targeted subgroups were sampled based on all key household demographic characteristics. Second, statistical raking was used to create calibration weights to ensure that the distribution of survey respondents matched the U.S. population with respect to a number of key demographic characteristics obtained from analyses of the 2019 and U.S. Census Bureau, 2021 Current Population Survey Annual Social and Economic Supplement (CPS ASEC).
Buyers tend to be more socioeconomically advantaged than the general population, and some potential buyers may be priced out of the residential real estate market. Therefore, as an additional robustness check, estimates were also reweighted to represent the general US adult population (not just successful buyers). Although specific point estimates changed with this alternative approach, the substantive trends did not differ.
Quality Control
To reduce response bias, survey respondents did not know that Zillow Group was conducting the survey. Several additional quality control measures were also taken to ensure data accuracy:
- We identified and terminated any professional respondents, robots or those taking the survey on multiple devices.
- Completion times were recorded to ensure that surveys submitted by the fastest respondents, who may have rushed through the survey, did not provide poor quality data. If necessary, these respondents were removed from the sample.
- In-survey quality control checks identified illogical or unrealistic responses.
Additional Data Sources
Unless otherwise specified, estimates in this report come from the Consumer Housing Trends Report (CHTR) 2022. To provide a fuller picture of the state of home rentals and buyers’ characteristics, preferences and behaviors, we also analyzed data from other sources:
- U.S. Census Bureau, 2019 American Community Survey – The most recently available dataset from the U.S. Census Bureau’s survey of the U.S. population. The ACS is the nation’s largest survey and is based on a probability sample; as such, it is considered one of the leading sources of information on U.S. population and housing.
- U.S. Census Bureau, 2021 Current Population Survey Annual Social and Economic Supplement – The CPS ASEC offers the most recent demographic estimates on the US population.
- Zillow.com website metrics – To provide additional context for survey results, ZG Population Science also examined internal Zillow data on listing information.
Digital Tools for Home Shopping
Prospective buyers largely agree with desire for tech tools
Prospective and successful buyers tended to have fairly similar desires/preferences for virtual tours and digital floor plans. For both groups, majorities of buyers generally agree at least somewhat with each statement.
| Share that agreed somewhat/completely with each statement |
Prospective Buyers |
Successful Buyers |
| 3D tours would help me get a better feel for the space than static photos |
68% |
66% |
| I wish more listings had 3D tours available |
62% |
61% |
| I prefer to schedule in-person tours online |
61% |
62% |
| It would be easier for me to unlock properties with my phone and tour them in-person on my own time |
65% |
64% |
| I wasted time during my home search viewing properties that I would have skipped if I had understood their floorplan before my visit |
54% |
50% |
| I’m more likely to view a home if the listing includes a floorplan that I like |
79% |
80% |
| The only way to really understand the layout of a home is to see it in person |
76% |
76% |
| A dynamic floorplan that shows what part of the home each photo depicts would help me determine if the home is right for me |
71% |
69% |
Prospective Buyers Trend More Relaxed
Successful buyers more likely to be hurried
Unsurprisingly, successful buyers were more likely to report a short (18%) or medium (40%) timeline to buy a home than were prospective buyers (12% and 33% respectively). Just over half of prospective buyers (54%) described their homebuying timeline as relaxed – versus 42% of successful buyers.
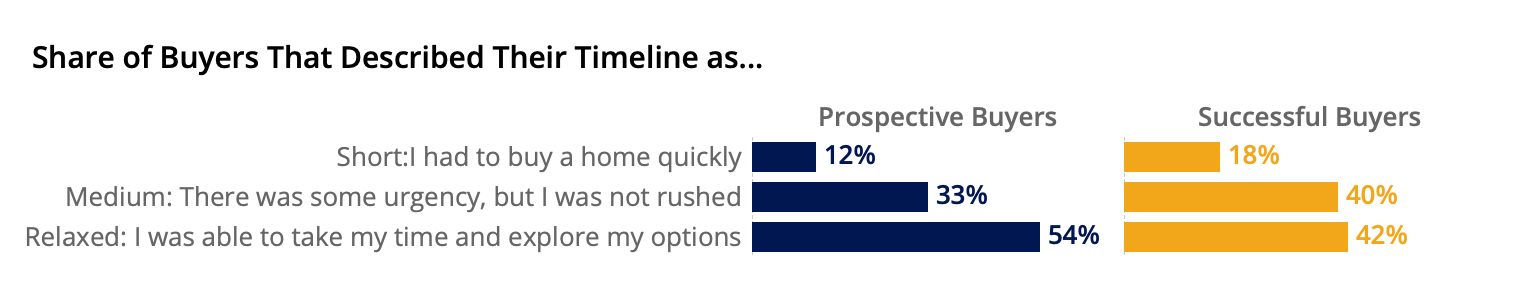
| Share of Buyers that Described their Timeline as… |
Prospective Buyers |
Successful Buyers |
| Short: I had to buy a home quickly |
12% |
18% |
| Medium: There was some urgency, but I was not rushed |
33% |
40% |
| Relaxed: I was able to take my time and explore my options |
54% |
42% |
Most prospective buyers are shopping for their primary residence
The largest share of prospective buyers (86%) say they intend to use their new home as their primary residence. Smaller shares say they intend to rent out the home (6%), resell or “flip” the home (4%) or use it as a vacation home or other secondary property (4%).
Two Thirds of Prospective Buyers Already Shopping Online
When asked about a series of homebuying activities they had completed, the largest share of prospective buyers (69%) reported viewing for-sale homes on a real estate website (e.g. Zillow, Redfin, Trulia, Realtor.com, etc). Prospective buyers were less likely to report completing other activities, like attending an open house or private home tour (38%), making an offer on a home (32%), and getting pre-qualified (27%) or pre-approved (25%).
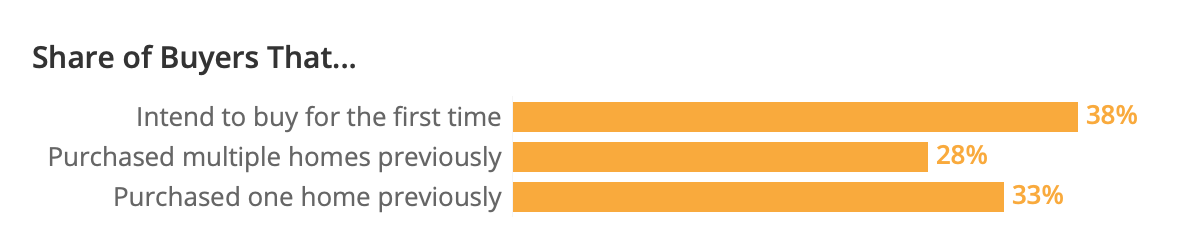
First-Time Buyers
Just over a third of prospective buyers (38%) say they intend to buy a home for the first time. A third (33%) say they had purchased one home previously, and the remaining 28% say they had purchased multiple homes previously.
Repeat prospective buyers are more likely to report having viewed homes on a real estate website (71% versus 66% of first-timers), attended an open house or private home tour (43% versus 30%), or gotten pre-qualified or pre-approved (42% versus 27%).[1] Repeat prospective buyers are also twice as likely as first-timers to have already made an offer on a home (40% versus 20%).
Most Prospective Buyers Intend to Finance with a Mortgage
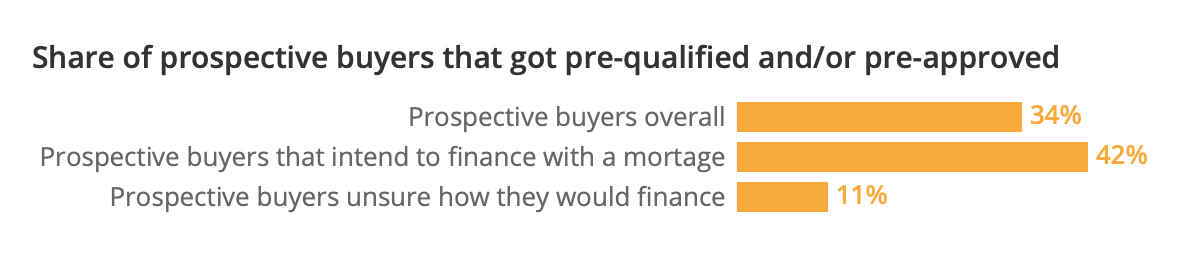
Most prospective buyers (63%) intend to finance their home purchase with a mortgage or home loan. About a quarter (27%) plan to purchase in cash, without a mortgage. And one in ten (11%) are not sure how they would finance their home purchase.
Prospective buyers who intend to finance their purchase with a mortgage are more likely to report getting pre-qualified or pre-approved. About two in five (42%) say they had completed the pre-qualify/pre-approval step – versus 11% of prospective buyers who were unsure of how they would finance and 34% overall.
A Quarter of Prospective Buyers Report Getting Pre-Approved
About a quarter of prospective buyers reported that they had gotten pre-approved (25%), and 18% reported getting pre-qualified (but not pre-approved). And a larger share (32%) said that they had saved up enough for a down payment (but had not gotten pre-qualified or pre-approved). About a quarter (26%) of prospective buyers reported completing none of pre-approval, pre-qualification, or saving up enough for a down payment.
Over Half of Prospective Mortgage Buyers Intend to Put Down Less than 20%
Prospective and successful mortgage buyers reported remarkably similar down payments – intended and actual. Pre-approved prospective buyers were more likely to plan to put down at least 20% as a down payment (56%) than those who had not gotten pre-approved (34%). About two in five (39%) prospective buyers that had only gotten pre-qualified (but not pre-approved) reported plans to put down at least 20%.
Just over half (58%) of prospective mortgage buyers[2] said they planned to put down less than 20% on the home they intend to buy – with the median planning to put down 10-19% of the final purchase price. These numbers are the same for successful buyers.
| Percent that Buyers Put Down or Intend to Put Down |
Prospective Mortgage Buyers |
Successful Mortgage Buyers |
| Less than 3% |
10% |
12% |
| 3% to 5% |
13% |
16% |
| 6% to 9% |
9% |
9% |
| 10% to 19% |
26% |
21% |
| 20% |
23% |
20% |
| Between 21% and 99% |
19% |
21% |
Resources Buyers Use When Shopping & Searching
More Buyers Searching Online
| Online resources used when searching |
Prospective Buyers |
Successful Buyers |
| Website on a laptop / desktop computer |
81% |
80% |
| Mobile website on a smartphone / tablet |
83% |
75% |
| App on a smartphone / tablet |
76% |
68% |
Prospective buyers report more use of low-tech search tools
| Offline resources used when searching |
Prospective Buyers |
Successful Buyers |
| For Sale or Open House sign |
59% |
51% |
| Home builder / sales center |
42% |
29% |
| Friend, relative, neighbor or colleague |
64% |
52% |
| Print ad |
39% |
26% |
| Direct mail (e.g. newsletter, flyer, postcard) |
34% |
23% |
The Buyer-Agent Partnership
60% Of Prospective Buyers Already Hired an Agent
Three in every five prospective buyers reported having already hired an agent. Two in five said they hired a real estate agent to help shop for a home (40%) and another fifth (20%) said they hired an agent to finalize the purchase, but intended to shop for a home on their own. About one in ten (13%) say they had not hired an agent, and did not intend to hire one. The remaining 28% said they had not yet hired an agent, but intended to hire one in the future.
Repeat prospective buyers were more likely to say they had already hired an agent (71%) than first-timers (41%).
Prospective Buyers Value a Trustworthy First Impression
Consistent with previous years, the top characteristic that buyers with an agent are most likely to consider highly important is a trustworthy initial impression (83%) – similar to 81% about a responsive initial impression.
| Consider each agent characteristic very or extremely important |
Prospective Buyers (All) |
Prospective Buyers that Hired an Agent |
Prospective Buyers that Contacted an Agent |
| Initial impression of agent or broker: trustworthy |
79% |
80% |
83% |
| Initial impression of agent or broker: responsive |
75% |
79% |
81% |
| Had local market and/or neighborhood-specific knowledge |
71% |
78% |
77% |
| Had strong negotiation skills and/or strategy to win an offer |
73% |
76% |
78% |
| Positive general reputation in the community |
72% |
75% |
75% |
| Referral from friend, relative, neighbor or colleague |
52% |
55% |
53% |
| Strong sales history / high number of recent sales |
58% |
62% |
60% |
| Online reviews and ratings of the agent or broker |
59% |
60% |
57% |
| Was part of a recognizable brokerage (e.g. RE/MAX, Coldwell Banker, Century21) |
44% |
47% |
45% |
| Past personal experience with the agent or broker |
55% |
59% |
55% |
| Charged a lower commission or offered a rebate |
57% |
57% |
56% |
| Agent or broker as part of a team |
45% |
50% |
44% |
In general, prospective buyers were more likely to be open-minded about home type than successful buyers. Most prospective buyers (71%) say they are at least willing to consider both new construction and existing homes. About one in five (18%) say they are only interested in existing homes, and one in ten (11%) are only interested in new construction.
|
Prospective Buyers |
Successful Buyers |
| I am more interested in existing homes, but willing to consider new construction homes |
40% |
32% |
| I am more interested in new construction homes, but willing to consider existing homes |
31% |
21% |
| I am only interested in existing homes |
18% |
31% |
| I am only interested in new construction homes |
11% |
16% |
Almost two thirds (64%) say they intend to buy a completed home. About a fifth (19%) intend to buy a home they can work with a builder to construct from scratch, and another fifth (18%) say they intend to purchase an under-construction home they can customize.
| Intend to buy |
Prospective Buyers |
Successful Buyers |
| A completed home |
64% |
69% |
| A home I could work with a builder to construct from scratch |
19% |
20% |
| An under-construction home I could customize |
18% |
12% |
New construction is more than suburban developments
Successful new construction buyers are most likely to say that they purchased in a subdivision or community of other new construction homes (67%). This finding is similar to last year, when 70% of new construction buyers reported buying in such a community.
Among prospective buyers that say they would prefer to purchase new construction, about two in five (40%) say they intend to buy in an existing community – slightly higher than the reality (33%) for successful new construction buyers. Homebuilders – consequently – may be able to meet more consumer demand by building more in existing communities.
|
Prospective Buyers that Prefer New Construction |
Successful New Construction Buyers |
| In a new subdivision or community of other new construction homes |
60% |
67% |
| In an existing community |
40% |
33% |
Location Among Top Reasons Prospective Buyers Report New Construction Apprehension
| Percent of prospective buyers who say they are less interested in new construction or didn’t initially consider new construction for each reason |
Reason less interested |
Reason didn’t initially consider |
| No new construction homes in my desired location |
39% |
55% |
| Prefer the style of older/existing homes |
42% |
52% |
| Couldn’t imagine what a new home would look like built |
27% |
36% |
| Concerns about quality of construction and/or building materials |
48% |
45% |
| Worried about depreciation/resale value of new construction home |
36% |
36% |
| Difficulty financing new construction, or easier to get a loan for existing home |
44% |
48% |
| Percent of prospective buyers who say each is a disadvantage or challenge of new construction |
| No new construction homes in my desired location |
50% |
| Prefer the style of older/existing homes |
32% |
| Couldn’t imagine what a new home would look like built |
35% |
| Concerns about quality of construction and/or building materials |
51% |
| Worried about depreciation/resale value of new construction home |
44% |
| Difficulty financing new construction, or easier to get a loan for existing home |
48% |
[1] The share of prospective buyers that got pre-qualified or pre-qualified (either-or, grouped) is from a different sample than whether a prospective buyer got at least one of pre-qualified or pre-approved. Numbers differ slightly between the different surveys.
[2] Among prospective buyers who intend to purchase their home with a mortgage (63% of prospective buyers). Prospective buyers who intend to pay for their home in cash or who are unsure how they would finance are not included.
