- The U.S. rate of negative equity among homeowners dropped a full percentage point in the third quarter of 2015, to 13.4 percent from 14.4 percent last quarter.
- More than 6.5 million Americans with a mortgage are underwater. More than 30 percent of Americans with a mortgage are effectively underwater, either in negative equity or lacking enough equity to comfortably sell their home and buy a new one.
- Negative equity affects not just the homeowners who are underwater, but entire markets where high rates of negative equity are slowing the recovery.
It’s said that what goes up, must come down, and that’s as true of negative equity as it is of anything else. But there’s no rule that says just because something is coming down, it can’t still mess things up.
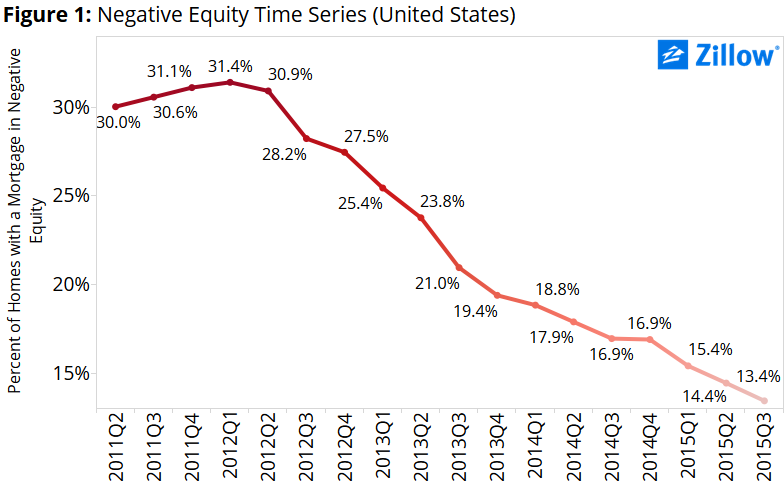 The U.S. negative equity rate – the share of mortgaged homeowners that are underwater, owing more on their home than it is worth – fell to 13.4 percent in the third quarter, from 14.4 percent in Q2 and 16.9 percent a year ago. The national negative equity rate has fallen or stayed flat for 14 straight quarters after peaking in the first quarter of 2012 at 31.4 percent (figure 1).
But despite that progress, more than 6.5 million U.S. homeowners with a mortgage remain trapped in negative equity. And those millions of underwater homeowners – located to some extent in virtually every market nationwide – are weighing heavily on a housing market still struggling to get back to normal. While negative equity directly only affects individual homeowners, it has a number of indirect impacts on local markets themselves.
Markets with particularly high negative equity rates usually (but not always) share a few common traits, including:
- Fewer homes for sale, especially lower-priced homes that are both more likely to be underwater, and more likely to be sought by first-time and entry-level homebuyers.
- Counterintuitively, homes that are for sale in markets where negative equity is more common tend to stay on the market longer.
- Higher risk for elevated foreclosure rates, as deeply underwater homeowners may be more likely to default on their loan if they can no longer keep up with the payments or decide to walk away from what has become a bad investment.
In general, negative equity is a barrier, one that prevents markets from working as smoothly as they otherwise might. The relationship between the negative equity rate in a given market and the typical time it takes for a home to sell in that market helps illustrate this (figure 2). Listings sell more quickly in markets with less negative equity, for a few likely reasons, but largely for one simple reason: The marketplace for buyers and sellers is more normal in places with lower negative equity.
Put another way: An underwater homeowner is, quite literally, trapped. If they want to sell their home, either they need to bring money to the closing table themselves to satisfy the difference between their outstanding loan amount and sale amount, or they need to work out a lengthy and complicated short sale. And if they want to buy a home, they can’t use the profits from the sale of their current home to help them afford the down payment and other homebuying costs, and instead must rely on personal savings, which could be inadequate.
This means negative equity impacts both supply of homes for sale, and demand for homes. So the usual marketplace of buyers and sellers is distorted. There may be more buyers than sellers, which can lead to localized price spikes and market volatility, as supply is inadequate to keep up with demand. That situation also often causes a mismatch between the types of homes that are more in demand versus the types of homes offered for sale. When there are more homes of a certain type available for sale than there are buyers that want those kinds of home, otherwise desirable homes may sit on the market longer.
Usually this distortion starts at the bottom of the market, home to many lower-end homeowners trapped in negative equity, constraining the supply of entry-level homes. First-time homebuyers then have a tough time finding available homes for sale. Inventory at the higher end, however, is often more readily available, as these homeowners are less likely to be underwater. But even for these homes, there are fewer move-up buyers because many are trapped underwater in the less expensive homes they already own. As a result, these more plentiful, perhaps more expensive homes stay on the market longer.
The market of Fayetteville, North Carolina, provides a good example. Home to Fort Bragg, one of the nation’s largest military bases, Fayetteville likely has no shortage of buyers as military members and their families come and go. In normal times, one might guess that homes would sell fairly quickly in the area. But our data indicates that the typical home listing was active for 105 days in Fayetteville as of the end of Q3, well above the national average of 78 days.
A possible explanation for the difference in how long listings stay active in a place like Fayetteville is not that the homes currently on the market are lemons, per se, or that Fayetteville is a bad place to live. It’s that, with a local negative equity rate of 28 percent (more than twice the national average), it’s much more likely that the kinds of homes that frequently change hands and are typically sought after by Fayetteville buyers are simply unavailable because they may be trapped underwater. And it’s harder to find buyers for those maybe more expensive or poorly located homes that are for sale.
Negative equity is slowly fading away, and its grip on the market will loosen over time. But it’s not fading overnight, either, and is likely to keep its grip tight at least through the end of this decade. Which means buyers and sellers in places with high negative equity, like Las Vegas, St. Louis and Fayetteville, can expect their markets to remain out of whack for years to come.
Where is Negative Equity Concentrated?
The Southwest, Southeast and parts of the Midwest continue to be plagued by negative equity rates in excess of the national average (figure 3). In the Southwest, Las Vegas (22.1 percent) and Phoenix (16.4 percent) continue to struggle with high negative equity rates. Chicago (20.6 percent) and St. Louis (17.6 percent) have the highest rates of negative equity among large Midwestern metros. In the Southeast, Atlanta (18.6 percent) and Orlando (16.1 percent) have some of the higher incidences of negative equity among larger metro areas.
On the flip side, there are many areas with below average rates of negative equity. Areas with the lowest rates of negative equity also tend to be areas where home values have surpassed their bubble-era peak or where home values weren’t as hard-hit after the housing bubble burst in 2007. For example, the San Francisco and San Jose metros have negative equity rates below 5 percent, which is roughly in line with what one would expect in a “normal” market.
Another common thread shared by these low-negative-equity markets is that they often have very robust job and income growth, which are strong drivers for the housing market. As workers move to these markets, they need housing, which drives up homes values (often rapidly) and in turn helps to bring the negative equity rate down.
Not Underwater, But Still Drowning?
Technical negative equity is easy to define: If the balance on your mortgage exceeds the value of your home, you’re underwater. But even if you have some positive equity, you could still be trapped in the no-man’s land of “effective” negative equity. These homeowners may have some equity in your home, but likely not enough to sell it and use the proceeds to comfortably afford the down payment and other costs associated with buying a new home.
Including those homeowners with less than 20 percent equity in their home, the U.S. effective negative equity rate jumps to 30.2 percent of homeowners with a mortgage (figure 4). Areas with the highest effective negative equity rates include Las Vegas (41.3 percent), Kansas City (38.1 percent) and Atlanta (37.9 percent). Even the nation’s hottest markets – San Jose and San Francisco – aren’t immune to effective negative equity, with rates of 7.7 percent and 11 percent, respectively.
Outlook
Negative equity has become almost an afterthought in a handful of the nation’s hottest markets, but is holding back the recovery in dozens of large markets nationwide. Despite steady declines in negative equity, many cities are still facing tight inventory, especially among entry-level homes. Those homes that are available are often not in demand and stay on the market for a long time. This can be extremely frustrating for buyers and sellers alike, as they come face to face with the difficult side effects of negative equity. Unfortunately, those side effects look set to linger for many years to come.

