Q3 2016 Homeownership Rate: Signs of a Turning Tide?
An encouraging quarterly uptick in the homeownership rate in Q3, and a close examination of its core driving factors, suggests the decade-long streak of annual homeownership declines may be on the cusp of reversing.
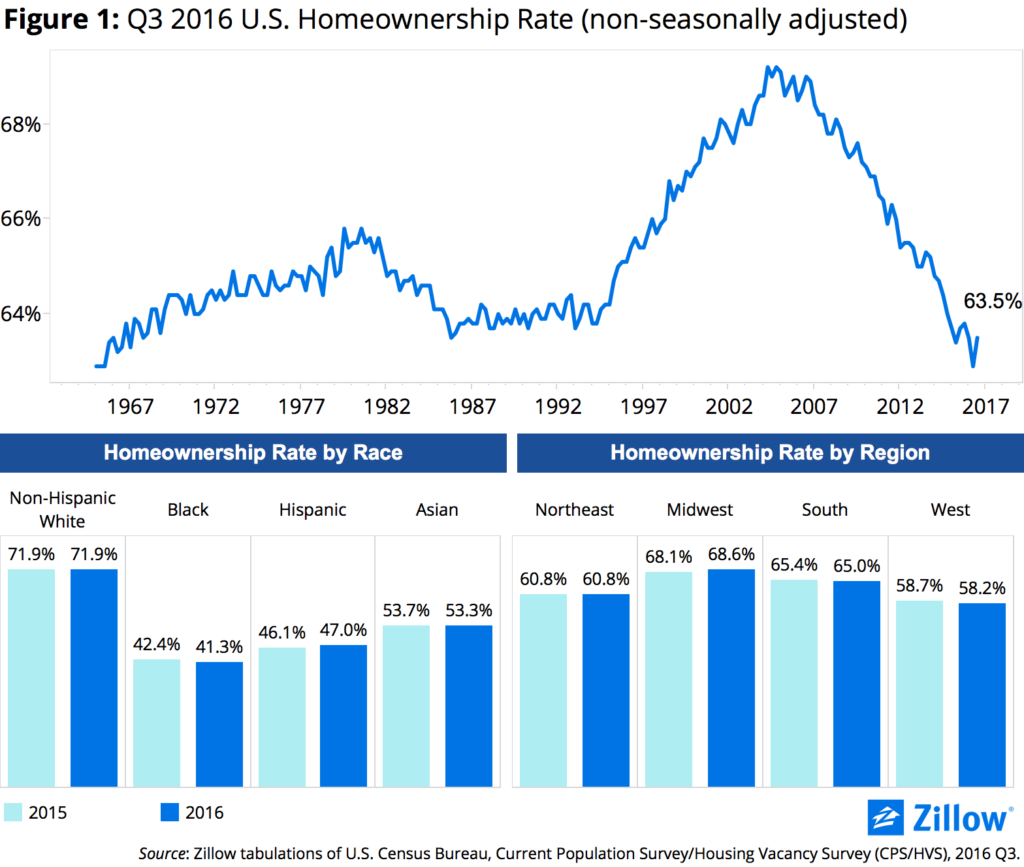
- The Q3 2016 homeownership rate rose 0.6 percentage points to 63.5 percent (non-seasonally adjusted), according to data from the U.S. Census Bureau’s Housing Vacancy Survey, negating the 0.6 percentage-point drop reported in Q2.
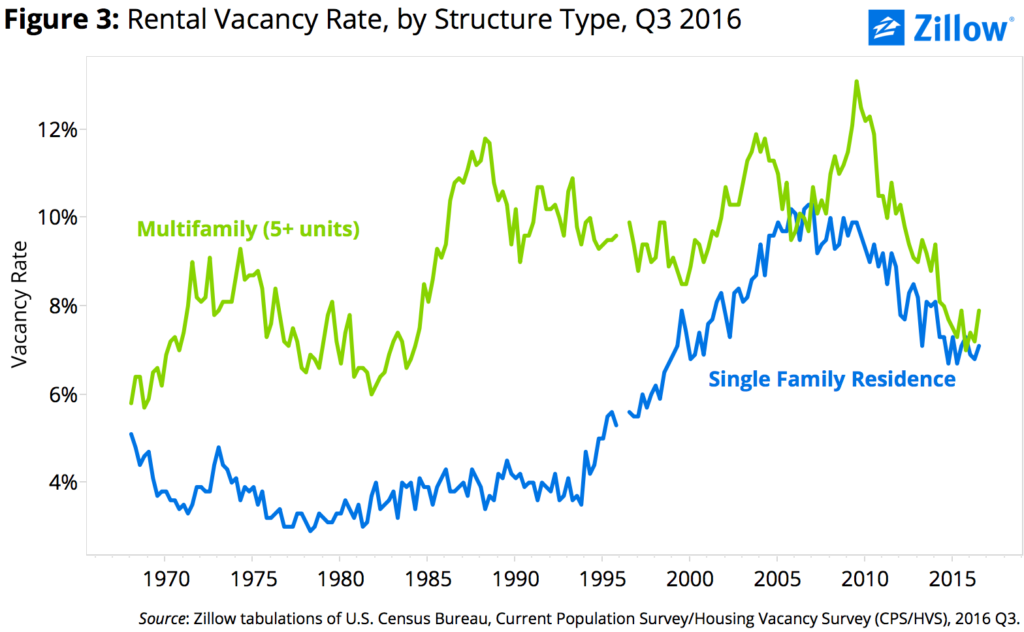
- The number of owner households grew by 922,000, while the number of renter households fell by 606,000. It was the largest quarter-over-quarter increase in the number of owner households since Q3 2001, and the number of owner households is now at its highest level since Q4 2010.
- Hispanics were the only racial/ethnic group to experience an increase in homeownership in Q3 compared to last year.
An encouraging quarterly uptick in the homeownership rate in Q3, and a close examination of its core driving factors, suggests the decade-long streak of annual homeownership declines may be on the cusp of reversing.
The U.S. homeownership rate rose 0.6 percentage points to 63.5 percent in Q3 (non-seasonally adjusted), according to data from the U.S. Census Bureau’s Housing Vacancy Survey, negating the 0.6 percentage-point drop reported in Q2 (figure 1).[1] Still, homeownership remains near historic lows, and fell 0.2 percentage points from Q3 2015. The homeownership rate has fallen on an annual basis for 40 consecutive quarters; the last time it posted a year-over-year increase was exactly a decade ago, in Q3 2006.
 But some still-tentative signals indicate this ten-year trend could soon come to an end. The number of U.S. households overall increased by 316,000 in Q3, up 0.3 percent from the previous quarter and 1 percent from a year ago. This increase is admittedly slower than the pace of household formation witnessed in late 2014 and early 2015, when household formations surged, but is in line with pre-recession averages.
 Perhaps more importantly, household growth in Q3 was driven by newly minted homeowner households. In the quarter, the number of owner households grew by 922,000 while the number of renter households fell by 606,000 (figure 2).[2] It was the largest quarter-over-quarter increase in the number of owner households since Q3 2001, and the number of owner households is now at its highest level since Q4 2010, perhaps because of an influx of first-time buyers entering the housing market. Compared to a year ago, however, renters are still driving household formation: The number of renter households is up by 628,000 (1.5 percent) since Q3 2015, while the number of owner households is up 561,000 (0.8 percent).
Hispanics were the only racial/ethnic group to experience an increase in homeownership in Q3 compared to last year. The Hispanic homeownership rate rose 0.9 percentage points compared to Q3 2015 (to 47 percent); the homeownership rate for non-Hispanic whites was flat at 71.9 percent. The homeownership rate fell 1.1 percentage points and 0.4 percentage points year-over-year for blacks and Asians, respectively (to 47 percent for blacks and 53.3 percent for Asians).
Across major regions, the homeownership rate continues to fall in the pricy, booming and supply-constrained West, falling 0.5 percentage points year-over-year in Q3 to 58.2 percent in Q3. Homeownership is also down year-over-year in the South, standing at 65 percent at the end of Q3, down 0.4 percentage point from last year. The homeownership rate was stable year-over-year in the Northeast, at 60.8 percent, and up 0.5 percentage point in the Midwest (68.6 percent).
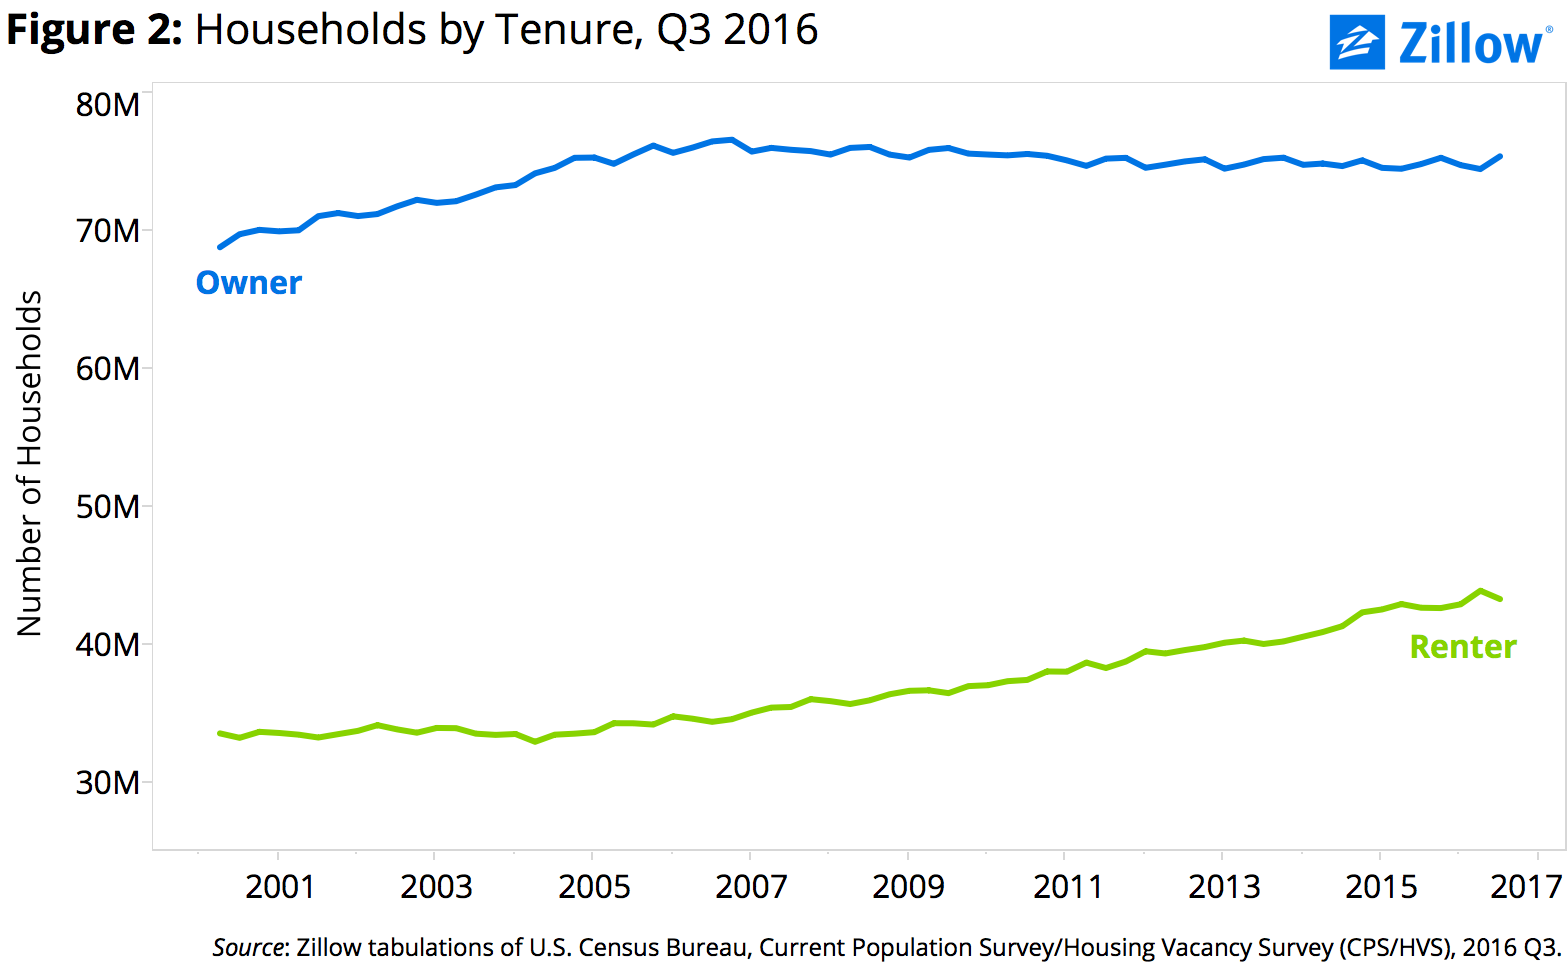
 But this shifting tide toward homeownership, while meaningful, has yet to visibly feed through to the rental market, which remains exceptionally tight. The rental vacancy rate was essentially stable in Q3 at its lowest rates since the mid-1980s. For apartments, the rental vacancy rate stood at 7.9 percent in Q3, unchanged from last year and just shy of its lowest rate since 1984. The rental vacancy rate for single-family homes was 7.1 percent in Q3, near where it has stood for much of the past three years, and in line with its lowest rates since 2000 (figure 3).
[1] The non-seasonally adjusted series is most commonly reported and is used in this brief unless otherwise stated. The Q3 2016 seasonally adjusted homeownership rate showed a quarter-over-quarter increase of 0.3 percentage point, to 63.4 percent.
[2] This is to be expected in non-seasonally adjusted data during the home shopping season.


