Gains Among Latinx, Young Homeowners Drive Q3 2019 Homeownership Gains
The U.S. homeownership rate rose to 64.8% in Q3 2019, up from 64.1% in Q2 and 64.4% in Q3 2018, according to the U.S. Census Bureau.

The U.S. homeownership rate rose to 64.8% in Q3 2019, up from 64.1% in Q2 and 64.4% in Q3 2018, according to the U.S. Census Bureau.
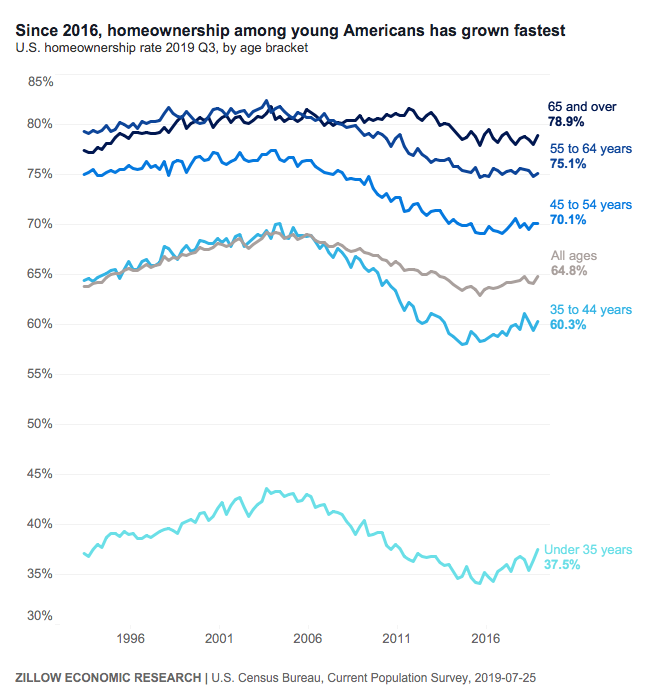
Strong gains among Latinx and under-35 home buyers continue to push the U.S. homeownership rate higher in Q3 2019, according to the U.S. Census Bureau, reaching 64.8% and matching recent highs set in both Q4 2018 and Q1 2014.
Though a far-cry from all-time highs approaching 70% last reached in 2004 – when the housing bubble preceding the Great Recession was in full swing – the national homeownership rate has been on a steady march upward after bottoming out at an all-time low of 62.9% in Q2 2016. At 64.8%, the current homeownership rate is largely in line with the historic average rate of 65.2%, dating to 1965. Much of those recent gains can be attributed to homeownership growth among Latinx and/or younger home buyers.
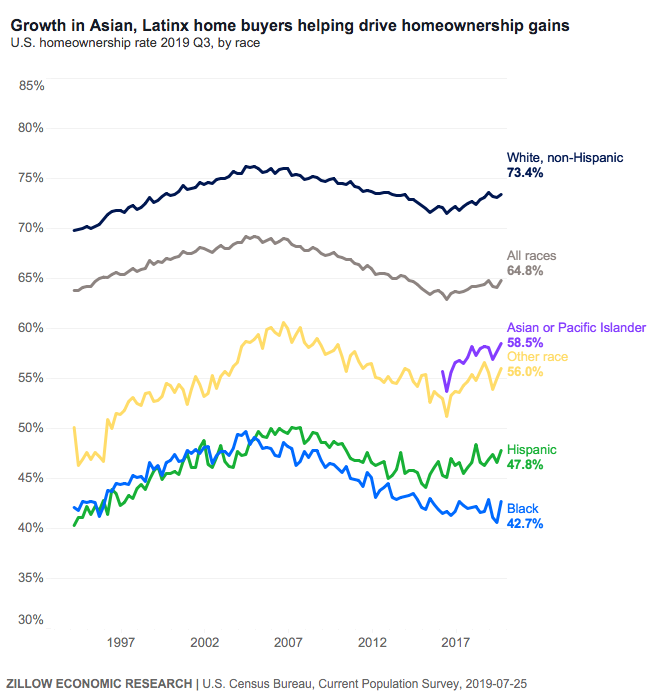
Between Q2 2016 and today, the homeownership rate among those under 35 years of age rose from 34.1% to 37.5% – a gain of 3.1 percentage points and the largest such jump among age groups analyzed by the Census Bureau (the next-highest jump was among 35-44-year-olds, from 58.3% to 60.3%). Over the same period, Latinx[1] homeownership rate rose 2.7 percentage points (from 45.1% to 47.8%). Asian[2] homeownership growth has been higher over that longer time frame – growing from 53.7% to 58.5% – but recent gains among this group have been smaller (up 0.3 ppts over the past year, compared to 1.5 ppts among Latinx).
Still, homeownership gains haven’t been widely shared by race over the same period. At the bottom of the homeownership cycle in Q2 2016, the homeownership rate among black residents was 41.7% – not far from the current level of 42.7%. The black and Latinx homeownership rates largely mirrored one another from the mid-1990s through the mid-2000s, before Latinx homeownership overtook black homeownership beginning in Q1 2005. Since then, the gap between Latinx and black homeownership has only widened, with Latinx rates steadily approaching the 50% threshold even as black homeownership rates languish in the low 40% range.
And this says nothing of the gap between white and black homeownership rates, currently close to the widest on record.
By region, the Q3 homeownership rate was highest in the Midwest (69%), followed by the South (66.2%), Northeast (61.7%) and West (60.6%). The homeownership rate in the South was 0.8 percentage points higher than in Q3 2018, while rates in the Midwest, Northeast and West were not statistically different from their rates in Q3 2018.
The rental vacancy rate in Q3 was down slightly in Q3, to 6.8% from 7.1% a year ago. Approximately 87.8 percent of the housing units in the United States in Q3 2019 were occupied, and 12.2 percent were vacant. Owner-occupied housing units made up 56.9 percent of total housing units, while renter-occupied units made up 30.9 percent of the inventory.
[1] Defined by the Census Bureau as “Hispanic, any race”
[2] Defined by the Census Bureau as “Asian, Native, Hawaiian and Pacific Islander Alone”
