- Home values in the bottom one-third of all homes rose 6.8 percent year-over-year in 2014, outpacing the 6.6 percent annual growth in all homes over the same period.
- Inventory of for-sale homes was up 12.2 percent year-over-year in December.
- Home values are expected to grow another 3 percent in 2015, according to the Zillow Home Value Forecast.
The bottom of the housing market both bore the brunt of home value losses throughout the recession, and recovered more sluggishly into the first few years of the housing recovery. But in 2014, the bottom came out on top.
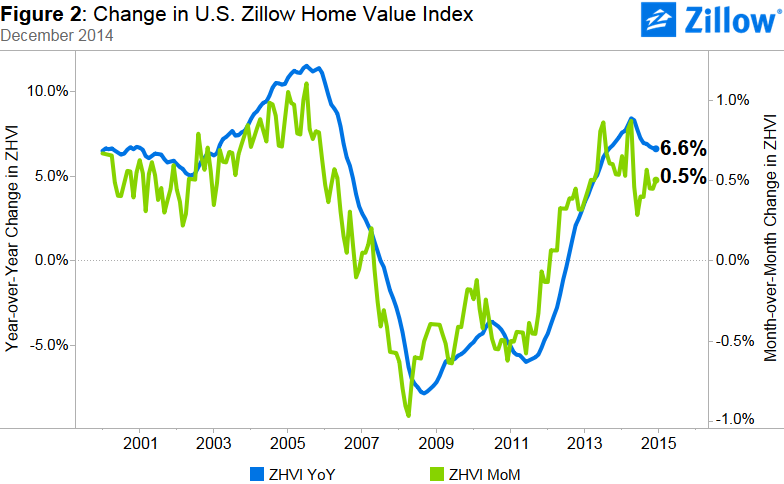
U.S. homes valued in the lowest one-third of all homes – typically the kind of entry-level starter homes sought by younger, first-time buyers – rose 6.8 percent year-over-year in December, outpacing the 6.6 percent appreciation pace of all homes overall. Home values in the bottom tier bottomed out in January 2012 with a median value of $84,100. By December, they had bounced back to a median value of $101,400. In the fourth quarter, home values in the bottom tier were up 1.5 percent over the third quarter.
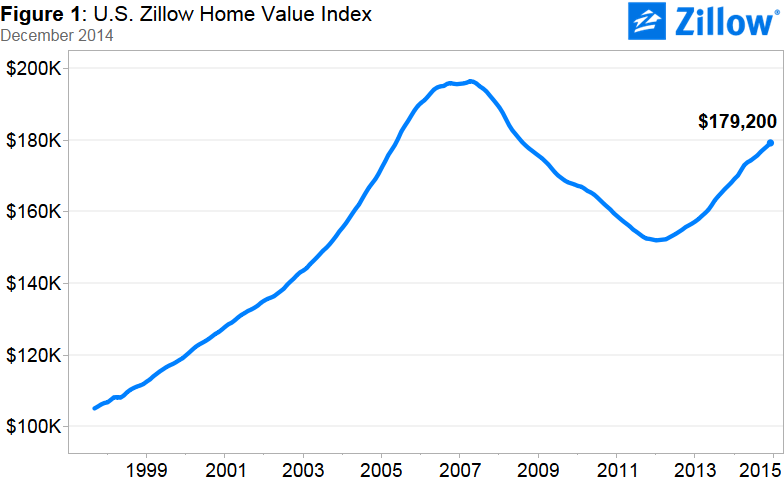
The overall median value of all homes nationwide rose 1.4 percent quarter-over-quarter, to a Zillow Home Value Index of $179,200. The median value of all U.S. homes is expected to grow another 3 percent through December 2015, to a Zillow Home Value Index of $184,520.
Above-trend home value growth in the bottom tier is especially noteworthy in the context of negative equity and inventory. Overall, the national negative equity rate – the share of homeowners with a mortgage who owe more than their home is worth – was 16.9 percent at the end of the third quarter. But homes in the bottom tier were roughly three times more likely to be in negative equity than the most expensive homes – nationwide, 27.4 percent of homes in the bottom tier were underwater in the third quarter, compared to 9.3 percent of homes in the top tier.
This concentration of negative equity at the bottom end has led to severe inventory shortages of entry level homes, since it is difficult – if not impossible – for an underwater homeowner to list their home for sale without bringing cash to the closing table. In December, Dallas and Denver had the largest inventory shortages in the bottom tier, with only 17 percent of homes for sale in the bottom tier of home values.
But as home values grow, negative equity recedes. Given high home value growth in the bottom tier, many entry-level homeowners who had been in negative equity are now able to refinance or sell as their home value have risen, boosting low-end inventory. And while bottom tier inventory still makes up a smaller share of for-sale inventory in many areas, the number of entry level homes for sale in December 2014 was greater than the number for sale in December 2013 for many areas. Metros with the biggest jump over last year in low-end inventory are Las Vegas (up 66.9 percent), Riverside, (up 47.3 percent) Washington, D.C. (up 45.7 percent) and Orlando (up 45.1 percent).
Looking ahead at the 2015 home shopping season, homeowners of lower-valued homes are emerging from negative equity just in time to meet growing demand from millennial renterss potentially pushed into the housing market by rising rents and abysmal rental affordability. Zillow expects millennials to overtake Generation X as the top home-buying generation in 2015.
Home Values
The Q4 Zillow Real Estate Market Reports cover 527 metropolitan and micropolitan areas. In December, 404 (77 percent) of these markets showed monthly home value appreciation, and 433 (82 percent) experienced annual home value appreciation.
Among the nation’s 35 largest metros, all but Indianapolis experienced year-over-year home value increases in December. Those with the most notable annual increases include Miami-Fort Lauderdale (14.7 percent), Denver (13.5 percent), Houston (12.3 percent), Atlanta (12.2 percent), Austin and Orlando (both 11.1 percent). Of the 35 largest metros, 28 experienced annual home value appreciation of 5 percent or higher.
Overall, national home values are still down 8.8 percent from their peak in April 2007. Of the largest 35 metro areas, six have home values that have surpassed their bubble-era peak in home values: Denver, Houston, Austin, San Jose, Dallas, and Pittsburgh.
Rents
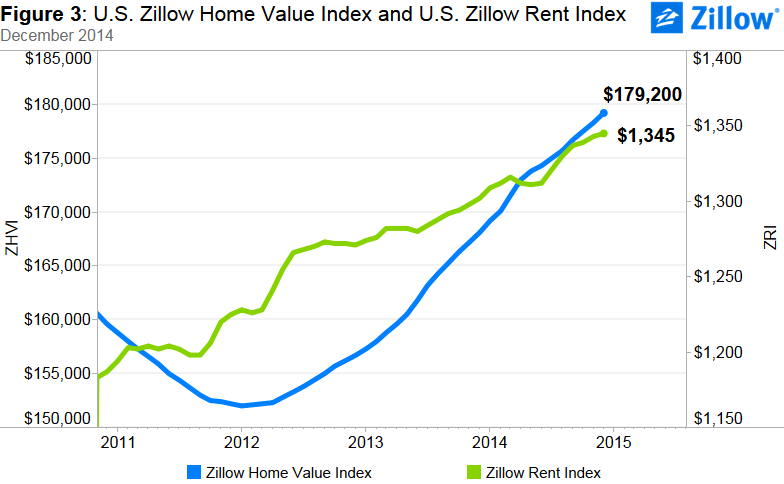 The Zillow Rent Index (ZRI) covers 862 metropolitan and micropolitan areas, and shows year-over-year gains in 644 (75 percent). In December, median U.S. rents rose 3.3 percent year-over-year (figure 3). Large markets that saw extremely strong annual rent appreciation include San Francisco (15.4 percent), San Jose (14.5 percent), Denver (10.5 percent) and Kansas City (8.5 percent). Rapid rental growth, particularly in higher-priced coastal markets, combined with sluggish income growth will lead to continued rental affordability concerns in many areas. Zillow expects rents to increase 3.5% over the coming year. Upward price pressures on rents will ease as demand shifts to for-sale properties and more multi-family units currently under construction are readied for occupancy.
Inventory
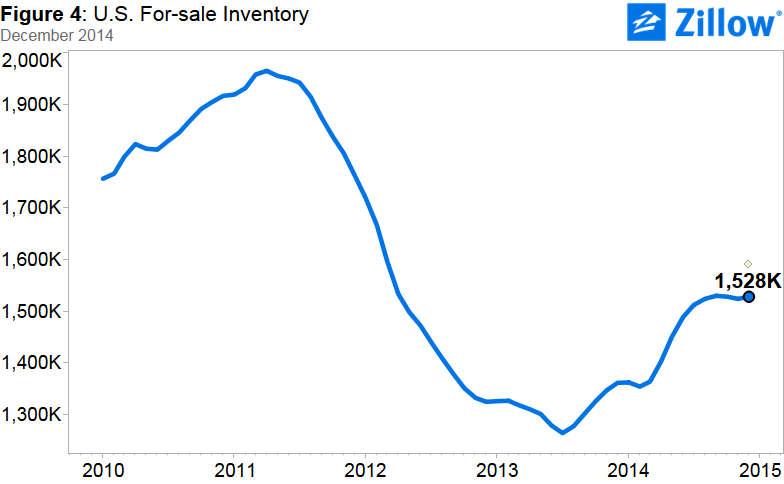 Nationwide, the number of homes listed for sale on Zillow was up 12.2 percent year-over-year in December, and has been essentially flat over the past four months (seasonally –adjusted). For-sale inventory remains 22 percent below its April 2011 peak of almost two million homes for sale. During the spring and summer selling season, inventory nationwide was rising at least one percent month-over-month. Starting in August, inventory gained less than one percent monthly, even falling slightly in October (-0.1 percent) and November (-0.3 percent). Inventory rose 0.3 percent from November to December (4077 homes).
Zillow’s for-sale inventory data covers 640 metro areas. In December, for-sale inventory rose on an annual basis in 480 metro areas (75 percent). Of the largest metro areas covered by Zillow, inventory rose the most over the past year in Riverside (36 percent), Orlando (34 percent), Sacramento (32 percent), Washington D.C. (31 percent) and San Diego (30 percent).
In many metros, inventory shortages are particularly acute among typical entry-level starter homes in the bottom tier of homes by home value. This supply tightness at the lower end of the market will continue to impact first-time home buyers and others trying to buy a lower-priced home, although we expect this tightness to loosen over the next year as those homes continue to gain equity.
There are some areas where bottom tier homes are more readily available. The share of homes available for sale in the bottom tier is 35 percent or higher in San Jose (46 percent), San Francisco (41 percent), Seattle (38 percent), New York (38 percent), Philadelphia (36 percent), Baltimore (36 percent), Boston (35 percent), and Washington, DC (35 percent).
Outlook
In many ways, 2014 was a transition year for the housing market. The severe inventory shortages experienced in 2012 and 2013 began to ease, which helped to alleviate some of the upward pressure on prices caused by high demand and tight supply. By the end of the year, we began to see concrete signs the market was moving out of the recovery phase and toward more normal conditions. In 2015, we expect the progress begun last year to continue as market conditions that had been tilted almost exclusively toward home sellers begin to shift back to buyers. More first-time and millennial buyers will enter the market as they begin to marry and have children en masse, and as persistently high rents force more to consider the relative stability and value of homeownership. More inventory is also expected to come on line, from sellers that have experienced several years in a row of healthy appreciation, homeowners freed from negative equity and new homes built. While hurdles remain, including stubbornly high negative equity and a shortage of entry-level homes, these ought to be balanced out by buyer-friendly conditions including continued low mortgage rates and home values that remain below peak levels. If 2014 was a transition year, expect 2015 to be a buyers’ year.
*Yes, we know our headline is grammatically incorrect. Take it up with Drake.
