Q4 2016 Negative Equity Report: Improvement Continues, But at a Much Slower Rate
The annual pace at which negative equity receded slowed dramatically in 2016, further proof that even as the housing market continues to put the boom and bust behind it, some scars will take a lot longer to heal.
- Nationally, 10.5 percent of homeowners with a mortgage were underwater at the end of 2016, down from 13.1 percent of homeowners a year earlier.
- In 2016, 1.2 million homeowners in negative equity were able to resurface, gaining positive value in their homes. Five million homeowners remain underwater.
- More than 55 percent of homeowners in negative equity are more than 20 percent underwater.
The annual pace at which negative equity receded slowed dramatically in 2016, further proof that even as the housing market continues to put the boom and bust behind it, some scars will take a lot longer to heal.
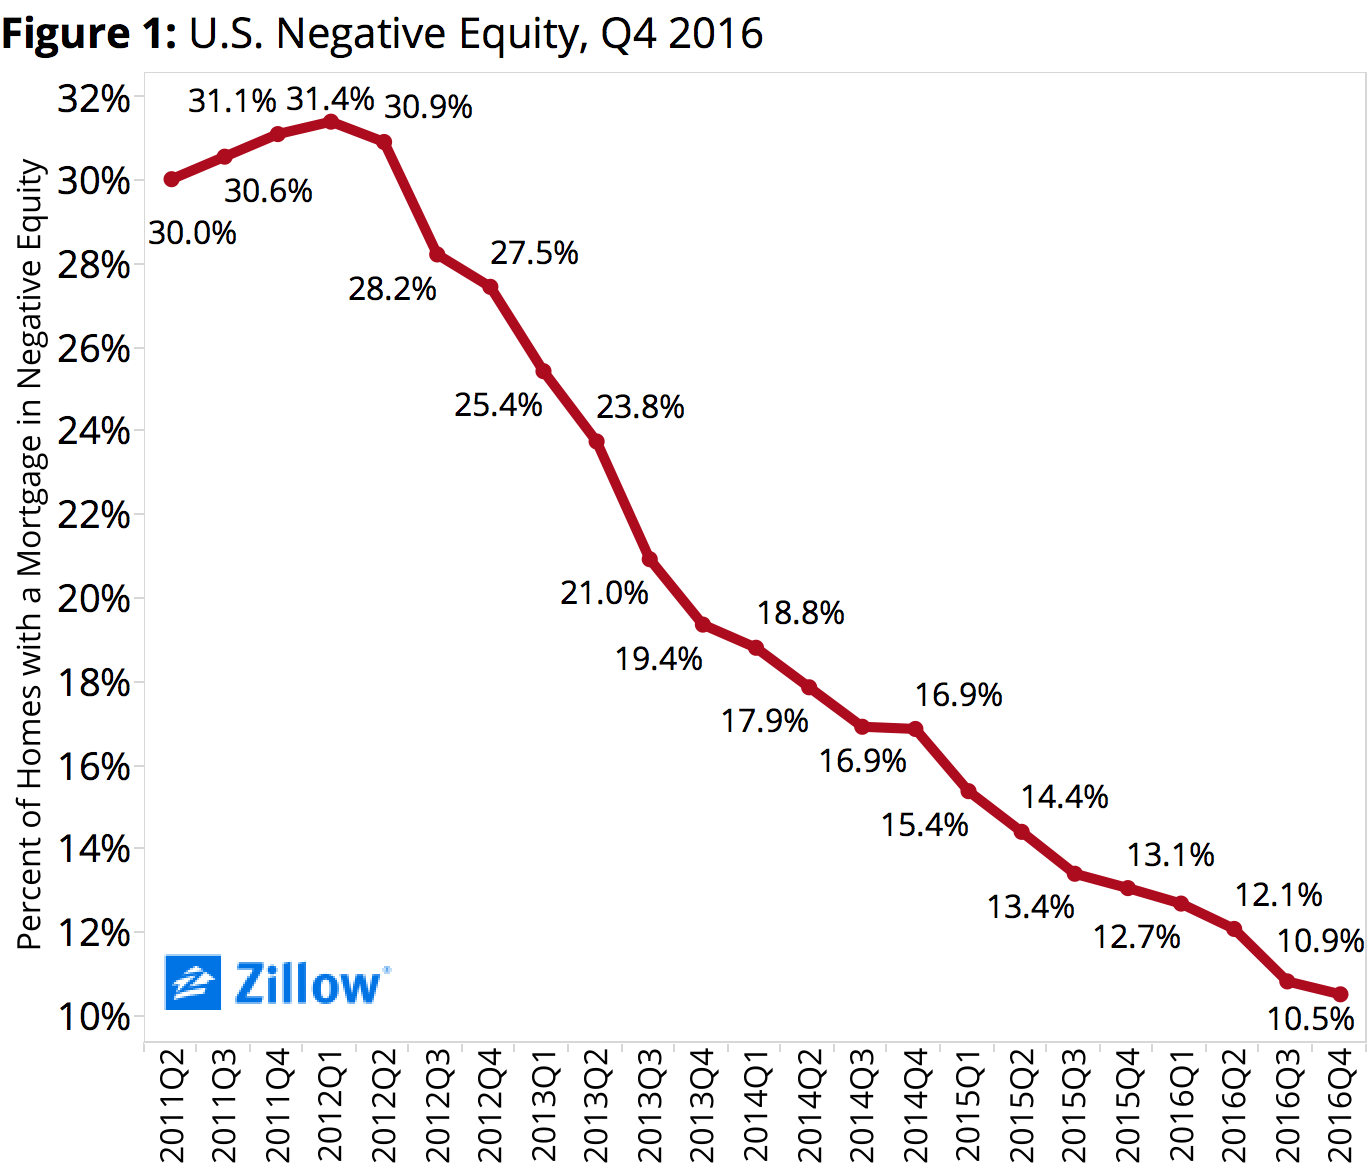
 The U.S. negative equity rate at the end of 2016 – the nationwide share of underwater homeowners, those with a mortgage owing more than their home is worth – fell to 10.5 percent, down from 13.1 percent at the end of 2015 (figure 1), according to the Zillow 2016 Q4 Negative Equity Report. That 2.6 percentage-point drop over the year is down substantially from the 3.8 point drop recorded between the end of 2014 and the end of 2015 (16.9 percent to 13.1 percent). Between the end of 2012 and the end of 2013, the U.S. negative equity rate fell a whopping 8.1 percentage points (27.5 percent in Q4 2012 to 19.4 percent by the end of 2013).
It’s important to note that a falling negative equity rate, even as its speed of reduction slows, is still very much a positive thing for the market. More than 1.2 million American homeowners with a mortgage were freed from negative equity in 2016. Currently, roughly 5.1 million homeowners nationwide are underwater, roughly one third the total number of underwater homeowners at the peak of the negative equity crisis in Q1 2012 (15.7 million). Negative equity can have a number of chilling impacts on local housing markets, disproportionately impacting minority communities and owners of lower-valued homes, exacerbating inventory shortages and increasing the likelihood of foreclosure for underwater homeowners. In that sense, any reduction in negative equity, no matter how small, should be welcomed.
But the fact remains that millions of homeowners are in negative equity, and the bulk of those that are underwater are deeply underwater, and unlikely to regain positive equity any time soon. More than 55 percent of all homeowners in negative equity nationwide were underwater by more than 20 percent as of the end of Q4 (figure 2). In additional to simply paying off your loan over time, the surest way to get out of negative equity is to wait for a home’s value to appreciate enough to bring it into positive equity. Home values grew at a robust 7 percent annual clip in 2016, well above historically “normal” home value growth of 3 percent to 5 percent. Even so, it would take several years of growth at that rate to free a homeowner underwater by 20 percent – to say nothing of the roughly 14.5 percent of underwater homeowners who owe twice or more what their home is worth.
There are other ways to eliminate negative equity, short of relying on loan repayment and/or simple home value appreciation. A homeowner can attempt to negotiate a short sale with their lender, hoping their lender will agree to take less than what is fully owed on a mortgage. In the event a lender refuses, a homeowner can also bring their own money to the closing table in order to make up the difference between the price offered on a home and the outstanding balance on the mortgage. Both solutions are complicated, time-consuming, risky and expensive – and so very uncertain.
The other sure-fire way to reduce negative equity is through foreclosure. When a home is foreclosed upon, all associated mortgage debt is wiped clean, and a homeowner can start anew (although, typically, won’t be able to get a new mortgage for at least seven years post-foreclosure). But in another indicator of just how much negative equity can distort the market, a falling foreclosure rate in this case is actually a “bad” thing. At the end of Q1 2012, the height of negative equity, roughly 7.2 out of every 10,000 homes nationwide was sold as a foreclosure. By December 2016, that rate had fallen to about 1.2 homes for every 10,000 nationwide. Fewer foreclosures means less negative equity wiped clean in that way.
All of which is to say that we should be prepared for negative equity to remain a part of the U.S. housing market for a long time to come. It is likely to continue to fall as home values increase, freeing those already relatively close to positive equity. But even as home values close in on peak levels reached during the housing boom, those deeply underwater homeowners still face a long wait before returning to a positive balance on their home loans. We’re likely in store for a kind of new environment in housing, one in which the longer-term level of negative equity is substantially higher than the roughly 3ish percent we’d expect to see in a historically “normal” market. Negative equity cut the housing market very deeply, and its scars are likely to be long-lasting.
Underwater, and Effectively Underwater
As of the end of 2016, Las Vegas and Chicago had the highest rates of negative equity among the largest U.S. metros, with 16.6 and 16.5 percent of homeowners underwater, respectively. The West Coast is home to all five major metros with the lowest rates of negative equity (figure 3).
Finally, even if a homeowner isn’t technically underwater but doesn’t have much equity, they can still have a lot of difficulty selling their home and using the proceeds to comfortably afford the costs of buying a new one, including a down payment, taxes and real estate commissions. Including the share of U.S. homeowners with a mortgage with 20 percent or less equity in their home, the national “effective” negative equity rate jumps to more than 25 percent (figure 4).
Among the nation’s 35 largest metro markets, the highest effective negative equity rates are in Virginia Beach (41.6 percent), Las Vegas (35.9 percent) and Indianapolis (33.7 percent). The lowest rates of effective negative equity among large metros as of the end of 2016 were in San Jose (6.6 percent), San Francisco (8.6 percent) and Portland (11.2 percent).

