Overview
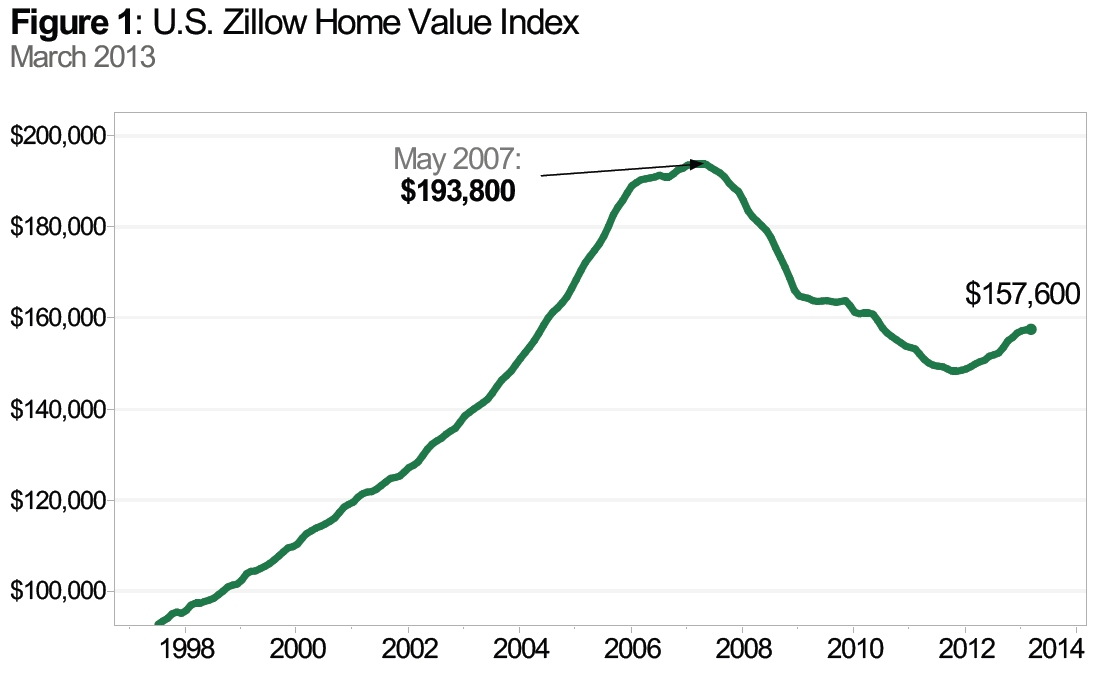
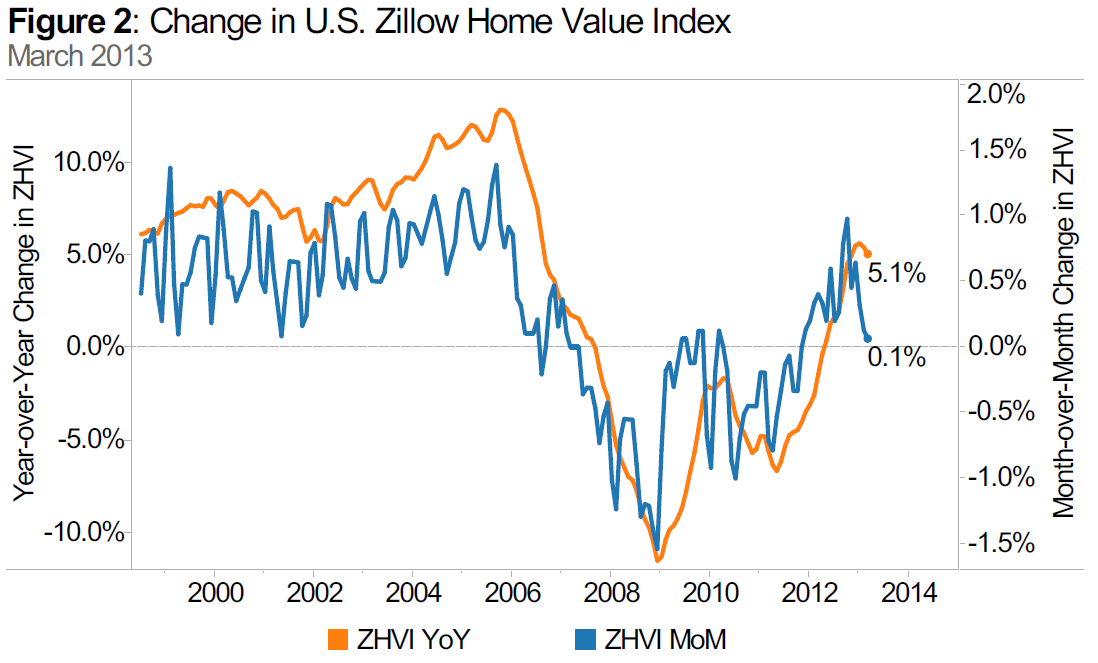
Zillow’s first quarter Real Estate Market Reports, released today, show home values increased 0.5% from the fourth quarter of 2012 to the first quarter of 2013 to $157,600 (Figure 1). This quarter marks five consecutive quarters of national home value appreciation. On an annual basis, the Zillow Home Value Index (ZHVI) rose 5.1% from March 2012 levels (Figure 2). While home values are still experiencing above normal annual home value appreciation we are seeing signs of deceleration. Monthly appreciation, albeit positive, has been continuously getting smaller, and national home values grew by only 0.1% for the past two months. This does not come as a surprise as appreciation rates have been unsustainable, especially in some of the markets harder hit by the housing recession. First signs of deceleration in terms of low quarterly appreciation or even depreciation can also be seen among the largest metros. Among them are Washington (1.2%), Boston (0.8%), Baltimore (0%), Chicago (-1.4%), St. Louis (-1.2%), Charlotte (-0.7%), Philadelphia (-0.6%), New York (-0.3%), Cincinnati (-0.3%) and Pittsburgh (-0.2%).
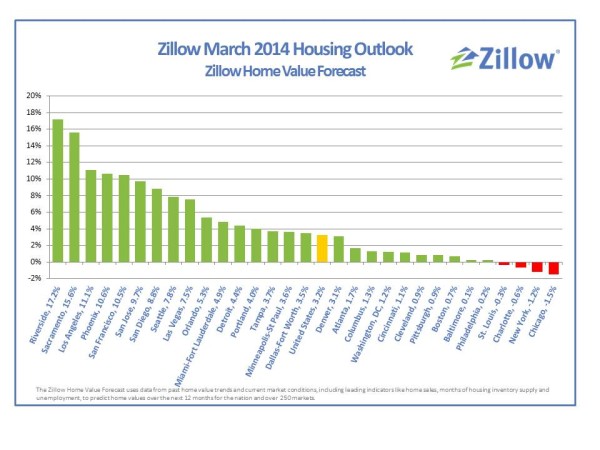
According to the Zillow Home Value Forecast (ZHVF), we expect national home values to increase 3.2% over the next year (March 2013 to March 2014). Of the 261 markets covered by the Zillow Home Value Forecast, 223 markets are expected to see increases in home values over the next year, with the largest increases expected in the Riverside metro (17.2%) and the Sacramento metro (15.6%). Many California markets follow closely at the top of the list of markets expected to see the highest home value appreciation over the next year. According to the ZHVF, 231 markets (89%) have already hit a bottom in home values, and another 18 are expected to hit a bottom by March 2014. Among the markets expected to see a bottom within the next year are Cincinnati (OH), Chicago (IL) and Philadelphia (PA). These markets have been gliding along the bottom for a while and have not seen sustained home value appreciation to lift them off that bottom.
Home Values
The Zillow Real Estate Market Reports cover 368 metropolitan and micropolitan areas (metros) of which 238 showed quarterly home value appreciation. Six metros remained flat, while 124 metros show home values losses. Approximately 75% of the metros covered by the Real Estate Market Reports posted annual increases in home values – a sign of the national housing recovery continuing to take hold. Among the largest metros, Phoenix showed the largest annual increase with home values rising 24% from the first quarter of 2012 to the first quarter of 2013. The largest 20 metropolitan areas are currently experiencing very different dynamics, as some metros are showing depreciation or slowing appreciation, while other metros are still strongly appreciating. We do believe that even those metros that are still strongly appreciating will return to more sustainable levels of appreciation. Many of these metros, such as Phoenix, Riverside, Sacramento and Las Vegas, were particularly hard hit during the housing recession and have seen home value declines in excess of 50%.
Overall, national home values are back to June 2004 levels, down 18.7% since their peak in May 2007. From their peak, home values fell 23.4% to the trough in home values in October 2011, and are now 6.2% above the trough level. A table of the top 30 metros can be found at the end of this report.
 Rents
Rents
The Zillow Rent Index (ZRI) covers 494 metro areas, and 70% of those metros reported annual increases in rents in March. As a point of comparison, nearly 75% of the metro areas covered by the ZHVI experienced annual home value increases. Nationally, rents increased 4.9% in March from year-ago levels, and rent growth continues to be robust, fueled by the entry of foreclosed households into the rental market and increasing household formation itself (newly formed households often choose to rent before buying). Markets that saw extremely strong year-over-year rent increases include Denver (10%), Boston (6.6%), Charlotte (6.5%) and San Francisco (6.4%).
Foreclosures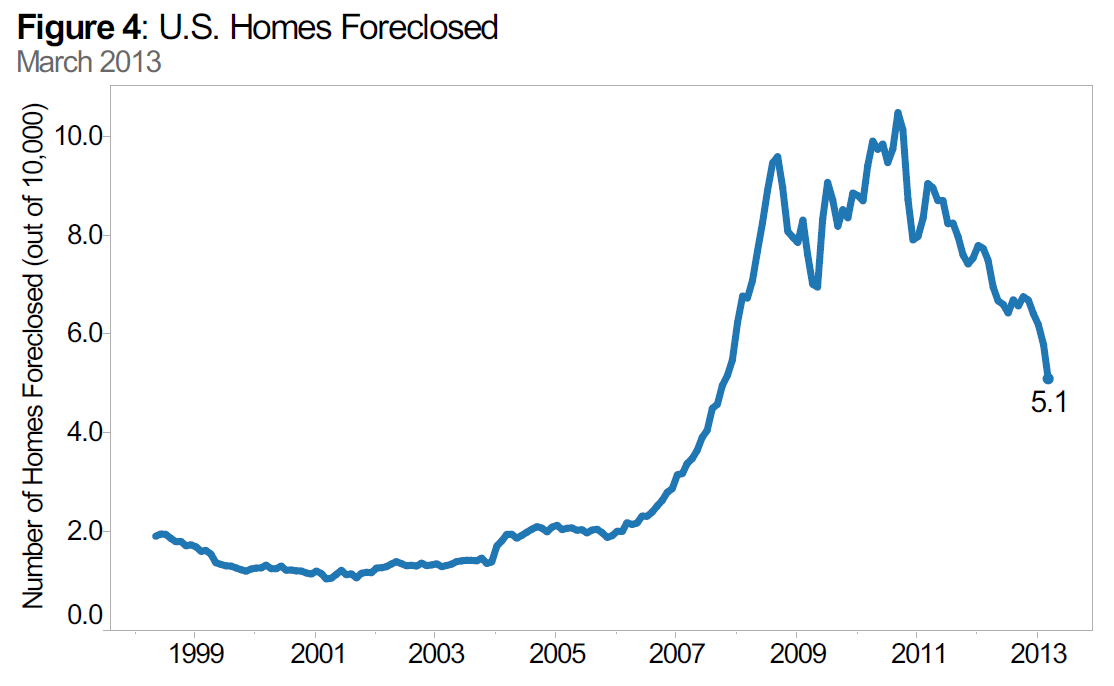
The rate of homes foreclosed continued to decline in March with 5.11 out of every 10,000 homes in the country being liquidated through foreclosure. Nationally, foreclosure resales remain low, making up 13.3% of all sales in March, down 3.8 percentage points from the first quarter of 2012, underlining the limited inventory of foreclosure resales. However inventory has been very limited in general, with many metro areas across the country having fewer for-sale listings available in March compared with last year. The lack of foreclosure resales and normal for-sale inventory in many markets is contributing to home value appreciation, as investors are buying up the distressed and non-distressed inventory, especially on the lower end of the housing market, squeezing out many conventional buyers, especially those requiring a mortgage instead of paying cash for a home.
Outlook
The housing recovery remains uneven across the country. Major metropolitan areas, such as New York, Chicago and Atlanta are still experiencing slight home value declines or are moving along a bottom in home values, while other metro areas are experiencing unsustainably high home value appreciation, such as Phoenix, Las Vegas and many part of California. While for-sale inventory still remains tight across the country, especially in the current “hot markets” of California, many markets are starting to see inventory constraints starting to ease. Steep home value appreciation rates are leading to fast declines in negative equity, with 27.5% of homeowners with a mortgage underwater in the fourth quarter of 2012. Metropolitan areas in California, as well as Phoenix and Las Vegas, have more than 40% and even 50% of homeowners with a mortgage underwater, so homeowners in these metros will be lifted out of negative equity at a faster pace than the rest of the country.
Further analysis can be downloaded here.

