Renters: Who is Most Likely Rent Burdened?


According to the latest U.S. Census estimates, nearly half of all renter households are cost burdened, meaning they spend more than 30% of their income on rent. Some of these households are more likely than others to face severe challenges in keeping up with rent.
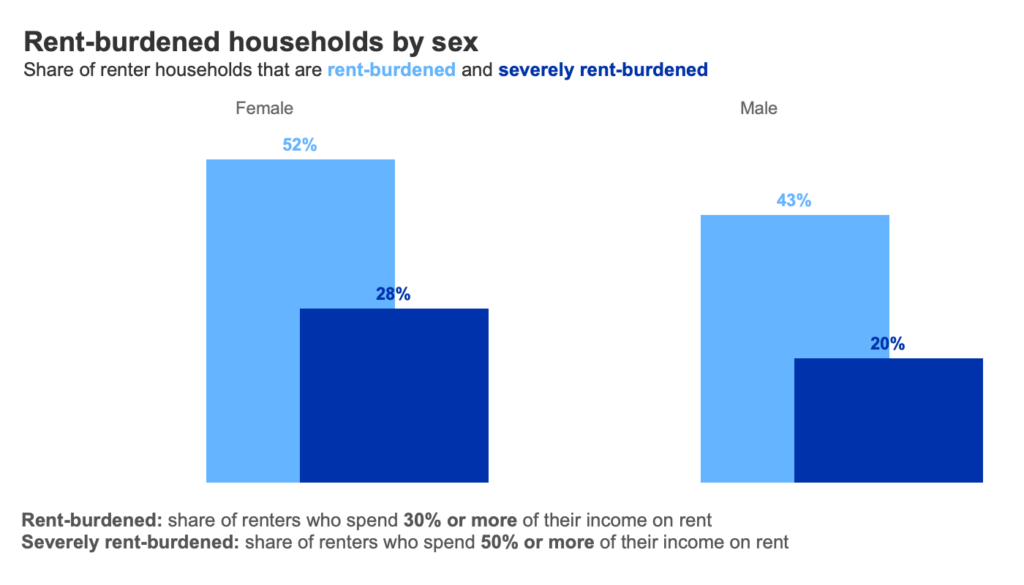
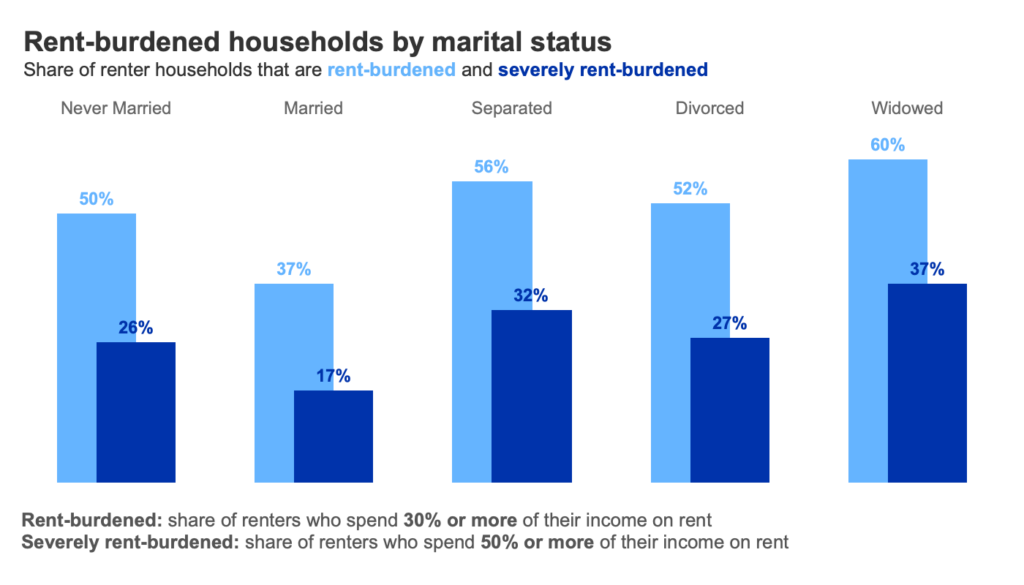
Households headed by women, living alone or living with children are more likely than any other group to find themselves facing housing insecurity. Married individuals are less likely to find themselves rent-burdened.

| Marital status | Share of renters who spend 30% or more of their income on rent | Share of renters who spend 50% or more of their income on rent |
| Married | 37% | 17% |
| Never Married | 50% | 26% |
| Separated | 56% | 32% |
| Widowed | 60% | 37% |
| Divorced | 52% | 27% |

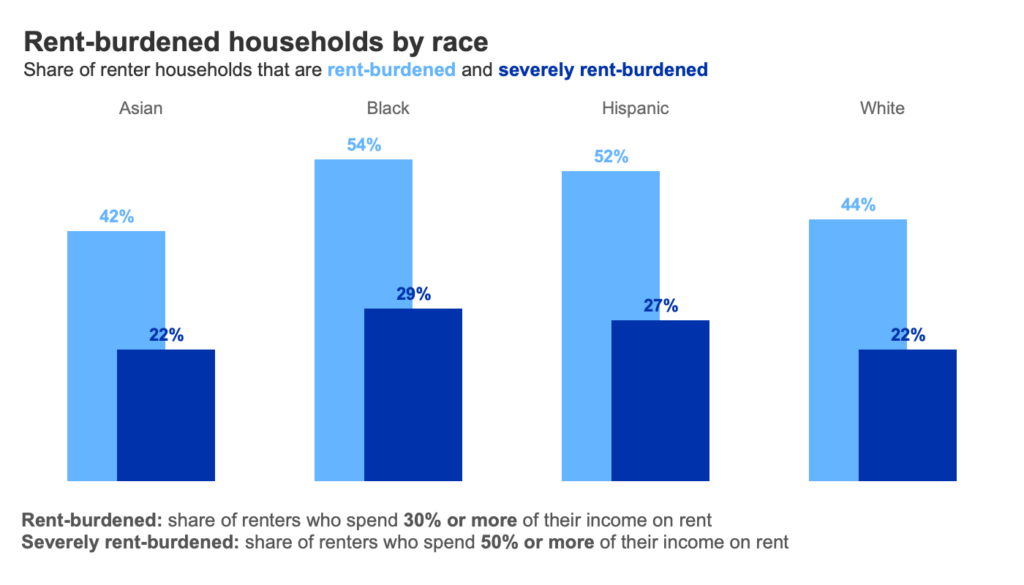
When breaking down the renter population by race, Black and Hispanic households are more likely to be rent-burdened than other groups. This is true even after controlling for education – generally a predictor of household income – and marital status.
Nearly nine million of the roughly 16 million (56%) Black households in the United States are renters. Among those, 4.9 million Black renters (54%) spent more than 30% of their income on rent, according to the latest data from the American Community Survey.

The share of Black households spending more than 50% of their income on housing was also the highest of any other group. Conversely, white and Asian American households were least likely to be severely rent-burdened.
Among the 50 largest metro areas, the largest shares of rent-burdened Black households were in San Antonio (69%), Riverside (68%), Tampa (67%), San Diego (66%) and New Orleans (64%). The largest shares of rent-burdened Hispanic households were in Miami (62%), Seattle (62%), Orlando (61%), Baltimore (60%) and Richmond (59%).
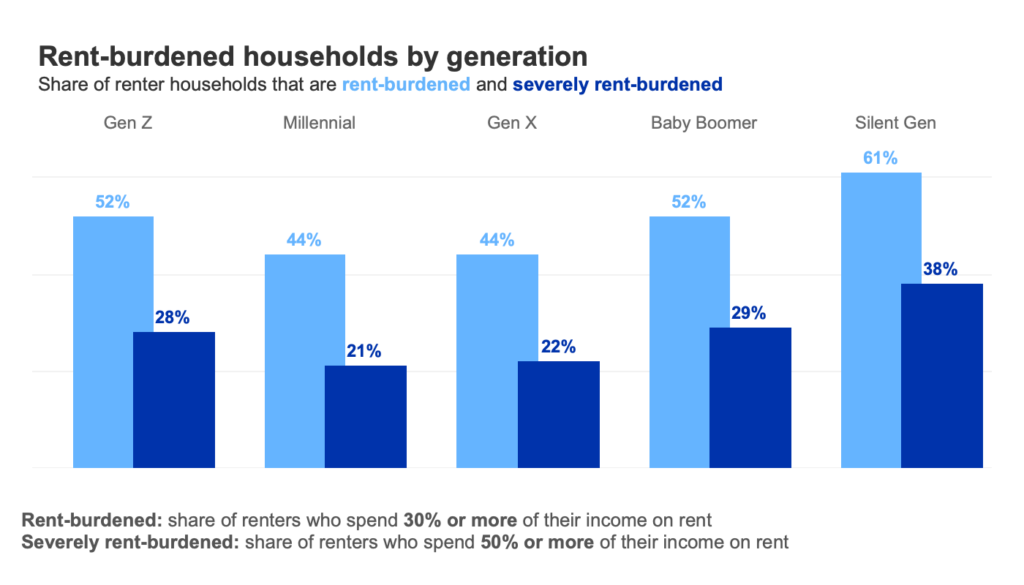
The oldest and youngest households are more likely to be rent-burdened than millennials or Gen Xers. Incomes are a key reason why.
At 61% of renter households spending more than 30% of their household income on rent, the oldest living generation — the Silent Generation — was most likely to be rent-burdened. This was followed by Baby Boomers and Gen Z — the youngest adult generation — with 52% of households within each generation being rent-burdened.
Millennials and Gen Xers, who are closer to their peak earning years, were least likely to be rent-burdened.
This is consistent with traditional income trends. Income tends to follow a “hump-shaped” pattern. Early in their careers, individuals typically have lower incomes, then as they gain more work experience, their incomes rise and peak during middle age when they’re most productive. Income typically declines when individuals retire.

To investigate whether household characteristics are determinants of housing insecurity we estimate the probit regression Pr(Rentburdened=I|X)=X where X is a vector of householder characteristics. Year and region controls are also included. We also include a dummy variable for the post-COVID years. The data is taken from IPUMS USA 2019, 2021, 2022, 2023 one-year samples and includes all renter households for which all the variables included in the regression are available.
Demographics matter: Younger, single, living‐alone renters are at much higher risk, while marriage and a college degree raise household income.
Those who live alone are 14 percentage points more likely than others to be rent burdened – all else equal. Male heads of household are 9 percentage points less likely to report being rent burdened than female heads. Whites are 6 percentage points less likely than other race and ethnic groups to be rent-burdened. A college education lowers the probability of being rent-burdened by 13 percentage points. Married heads of households are 6 percentage points less likely to report being rent burdened than other households.
Nonlinear age effect: Rent burden declines with age up to around 60, then slowly rises for the oldest renters.
Life shocks: Childbirth creates a meaningful spike in burden risk, suggesting the transition strains renters’ finances.
| Dependent Variable: Rent Burdened=1, Not Burdened=0 | |
| Marginal effects (in percentage changes) | |
| Male | -0.09 *** |
| Age | -0.01 *** |
| Age_SQ | 0.0001 *** |
| Race: White | -0.06 *** |
| Household Size: living alone | 0.14 *** |
| College Degree | -0.13 *** |
| Married | -0.06 *** |
| New Child | 0.07 *** |
| Obs. | 897154 |
| Significance level | *** indicates p<0.001 |