ZORI and Shelter CPI: Less of a Lag, More of a Drag

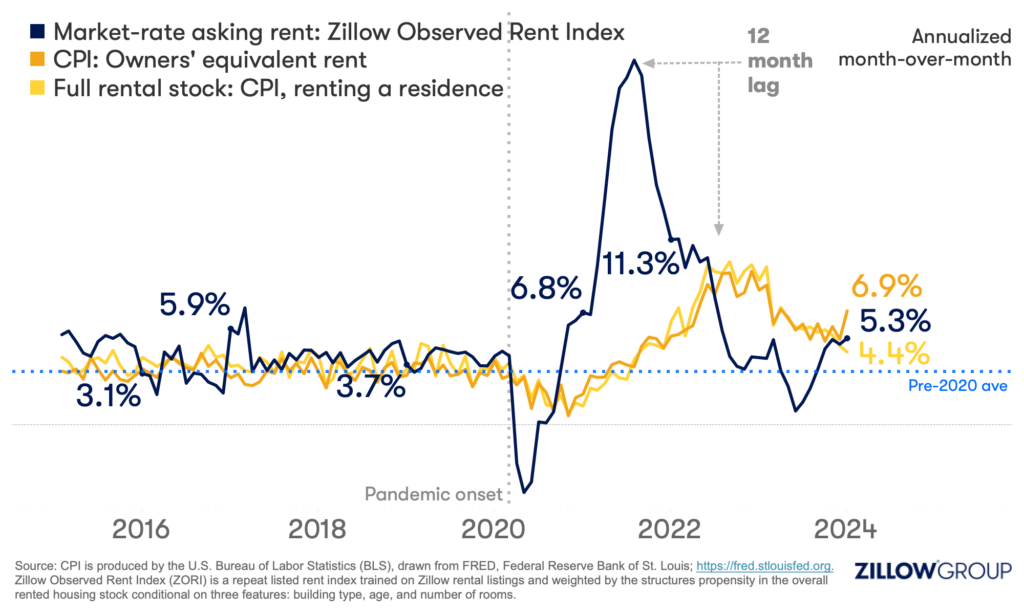
In some ways more “core” than core inflation, the shelter component of the Consumer Price Index (CPI) has been one of the most watched economic indicators of the past several months. [1] Other measures of monthly inflation have been near the 2% target for several months, but annualized monthly shelter inflation still sits well over 5%, and has been stuck there for months. While other macro signals like persistent strength in the labor market and bumpy recent inflation readings have guided the Federal Reserve to maintain their policy rate at a restrictive level for longer into this year, elevated shelter CPI shouldn’t necessarily be a worrisome signal, as surprising as that sounds.
As we’ll show, annualized changes in shelter CPI can remain elevated long after rent price growth cools. Using a simple model of the housing market where renters move from “off-” to higher “on-” market rents over time, we show that even if on-market rent inflation proceeds at a 2% pace (consistent with target and below the recent historical average of 3.6%), then annualized month-over-month changes in shelter CPI will likely remain closer to 3% even as late as year-end 2026. These are reasonable targets consistent with a 2% long-run shelter inflation rate, and 2% overall inflation rate, despite seeming so high.
With this reasoning, the Fed may indeed soon gain enough confidence in sustainable inflation to ease off the brakes and let the American economic machine roll on.
Reliable on-market rent indices, such as the Zillow Observed Rent Index (ZORI), showed that rent price increases slowed on a monthly basis starting in September 2021 and even fell below a 2% annualized rate in June 2023. A 12-month lag between measures like this of on-market rent and the shelter component of CPI was fairly established. This relationship is explained by a common-sense argument based on the typical annual lease arrangement and on a comparison between when ZORI (on-market) and shelter CPI (full-market) monthly rent growth rates hit their peak pace during the pandemic (August 2021 and September 2022, respectively).
However, as described above, more than twelve months after that peak, the slowdown in CPI, and its shelter component, has stalled.
The answer to why lies in the fact that CPI’s shelter component actually captures two markets, and the move between them. Shelter CPI is a measure of cost of rent, but the (average) cost of rent can increase in two ways.
Either:
Understanding shelter CPI changes requires the consideration of how many renters are moving and how far the market-rate rent is above the rent that current renters are, generally, actively paying. Once we understand how these factors work together, the persistently high growth rates of shelter CPI even after on-market measures like ZORI have returned to normal makes much more sense.
To illustrate this dynamic, we will start by considering a simple scenario, and then build on it.
What would shelter CPI, or full market rent, look like with a single 20% jump in market-rate rent? If nobody moved, then nobody would experience a rent increase, and the monthly change in shelter CPI would be 0%. But people have to move. [2] Let’s say annually 20% of renters move into this suddenly more expensive renting environment. [3]
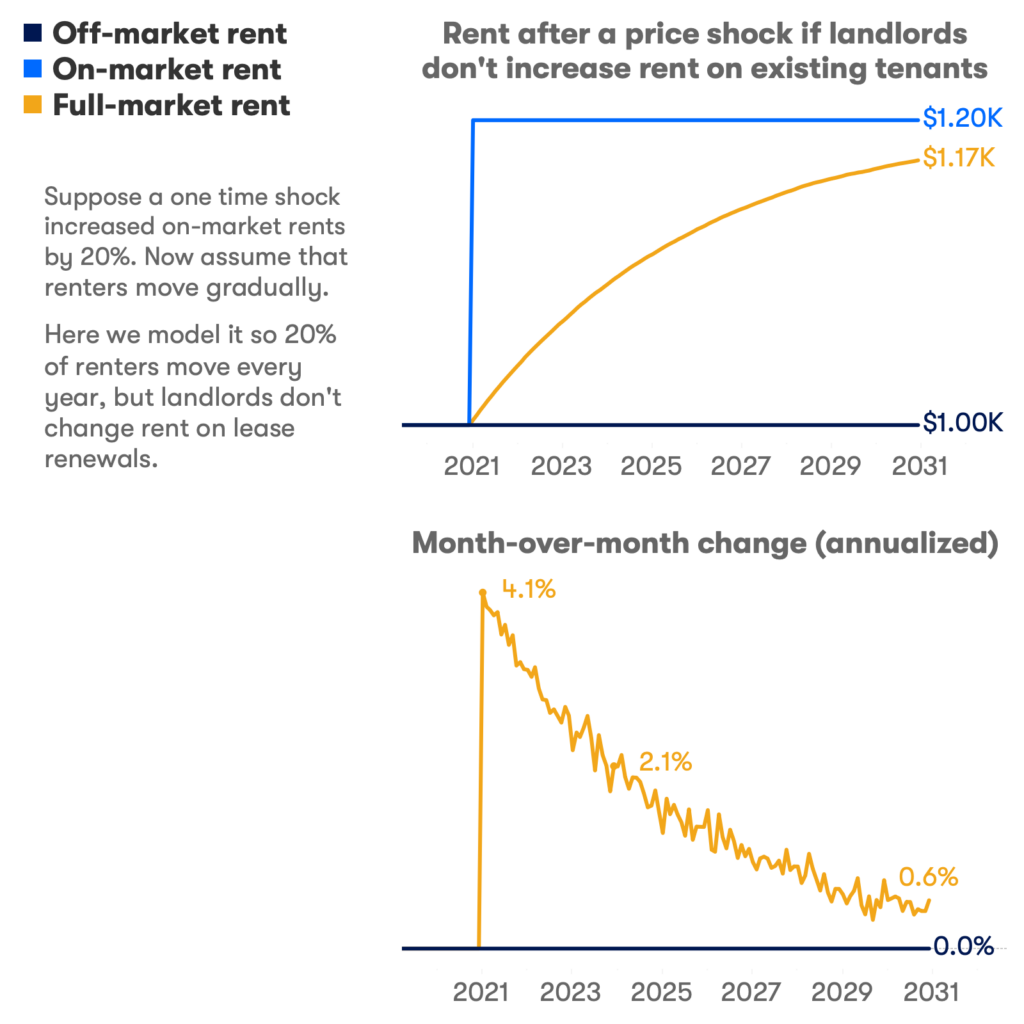
We can see that annualized monthly growth in average (full market) rents would increase beyond 4% in the first month following the shock, before decelerating. The growth rate decreases over time because, after a while, fewer people are experiencing this higher cost environment for the first time; many of the people moving in a given month had already moved after the price shock, so nothing changes for them. However, and this is the important part, even after ten years, there are still enough people moving for the first time that average rents still increase, despite no actual rent changes on a given unit in a decade. [4] So, it takes over a decade for the entire rental market to absorb the full one-time 20% price increase to on-market rent in this simple example.
Now let’s add the complexity that landlords often increase rent for their existing tenants. A landlord will generally not want to risk losing a good tenant by increasing the rent by too much at once, and certainly not above market-rate rent. Let’s assume that landlords will raise rents by a fifth of the difference between current rent and market-rate rent in a year. Adding just that landlord catchup to our simple model, what happens to shelter CPI?
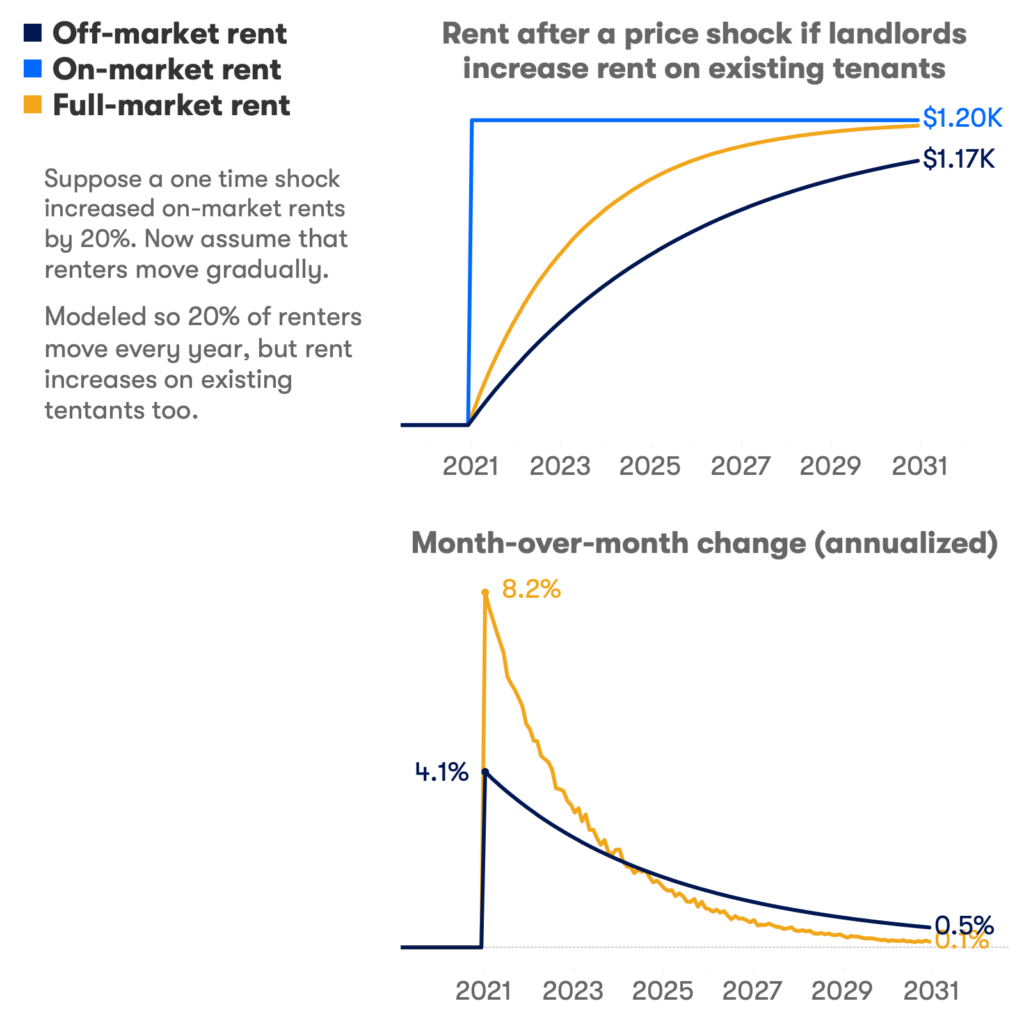
We added no extra pressure to on-market rents, but adding the existing landlord’s incentive to increase off-market rents causes our CPI shelter proxy to spike much higher, to over an 8% annualized monthly growth rate. However, the full market does absorb the rent increase more quickly but still, it takes nearly a decade for the one-time 20% shock to on-market rents to work its way through average rents.
ZORI is an on-market repeat rent index weighted to reflect all rental units in the United States. Instead of a single shock to the market, let’s now use ZORI as our gauge of on-market rents.
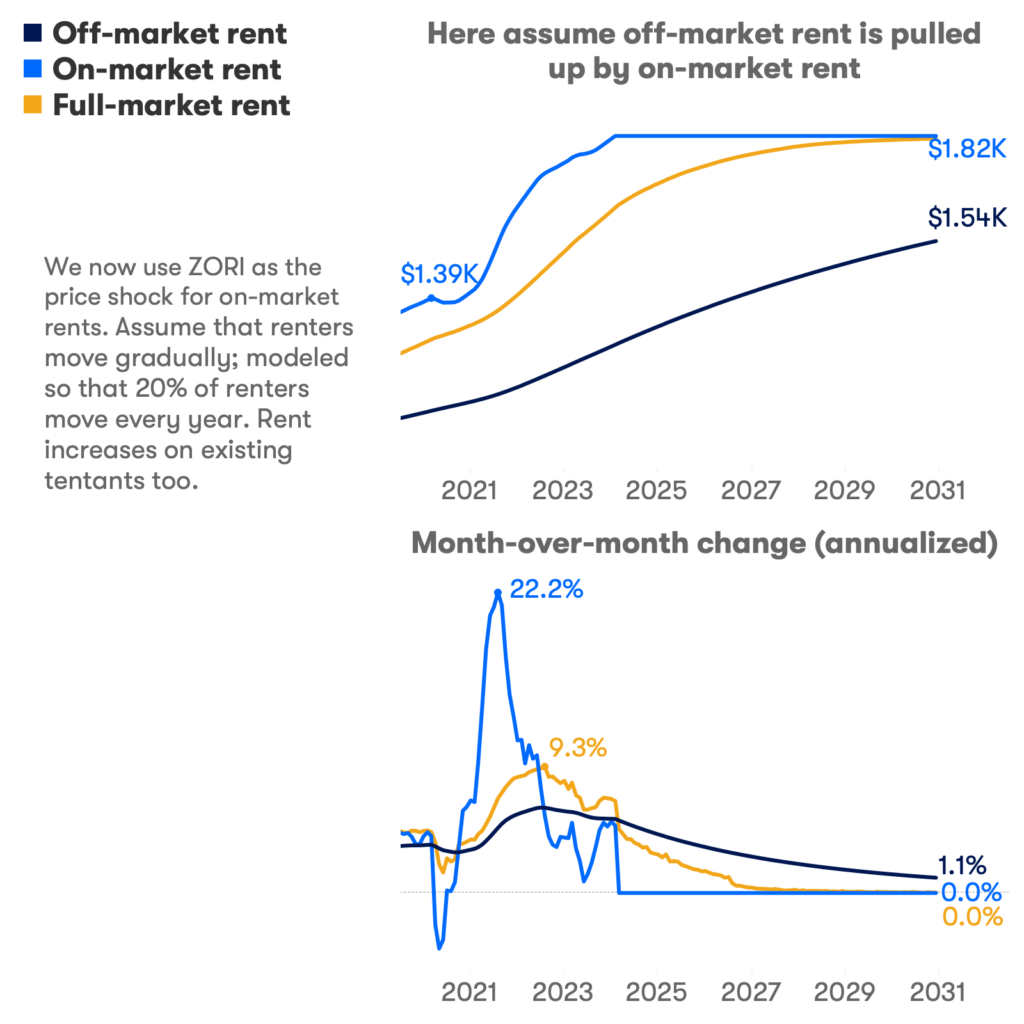
ZORI (blue line above) fell quickly as the financial conditions tightened in 2022, and off-market rents played some catchup. But increases in average rent, our proxy for shelter CPI, outstrip both between August 2022 and now. Average rent increases have exceeded both on-market and off-market rent increases for a year and a half! This is because the market environment had a major shock a few years ago. The on-market expectation jumped to a more expensive level back in 2021 and we have been playing catchup with indicators ever since. A flattening of on-market rents is not sufficient to bring down increases in average rents because the target level is so high relative to rents more broadly. Just as in our extra-simplified models above, we should expect the on-market rent shock to be realized only slowly, as renters move.
Since ZORI is observed only up to the most recent month, let’s assume for the sake of demonstration that there are no more increases after last month (February 2024). From our simulation, we see that average rent growth does not fall to 2% until the second half of 2025. As landlords increase rent toward market level, renters who move will take less of a hit, relatively. It would take until 2028 for off-market rent increases to fall to 2%, but over this time fewer and fewer renters will be impacted.
This interplay between on-market, off-market and average rents implies that for the Fed to reach its 2% target for overall inflation (the Fed’s target refers to core PCE – another commonly-cited inflation gauge) this year is impossible without substantial declines in on-market rents or a near-halt in renter mobility. Either such occurrence would involve an extreme economic event, not something the Fed wants.
So what’s realistic? If on-market rent increases proceed at a 2% pace (recent historical average is 3.6%), then the expected annualized month-over-month change in shelter CPI by year-end 2024 is around 4.4%. Year-end 2025, 3.5%. Year-end 2026, 3.1%. These are reasonable targets consistent with a 2% long-run shelter inflation rate. These values can stay above 2% for a long time because of gradual renter mobility into an already more expensive market, not just some persistent (but “lagged”) driver of price growth.
[1] The cost of rent is a major component of the representative individual’s overall “market basket”. The market basket is the standard set of goods and services used by the Bureau of Labor Statistics (BLS) to calculate the Consumer Price Index (CPI) which measures broad price changes, i.e. inflation. Rents account for roughly 32% of CPI, 7.7% directly, and 24.4% indirectly through “owner’s equivalent rent”. This means changes in the rents paid carry a lot of weight in inflation, and correspondingly asset valuation and Fed policy.
[2] About 20% of renters had moved in the past year according to 2021 Census surveys (American Community Survey: 22%, Current Population Survey Annual Social and Economic Supplement: 17%). This mobility rate has been in decline for the past several years.
[3] We simulate 10,000 households observed for 180 periods (months), an on-market rent observed in each period, an off-market rent observed in each period, and a constant mobility rate (the probability of moving in any given period).
[4] We can imagine in this situation, that if no renters moved, the average rent paid would not change. This is how mobility can directly affect CPI regardless of price changes in a period.
