Renters: Results from the Zillow Consumer Housing Trends Report 2025

To gain a comprehensive understanding of US renters, Zillow Group Population Science conducted six nationally representative surveys – each sampling at least 6,500 renter-respondents. In total, the surveys contain information from over 24,400 unique renters – more than 5,700 recent renters and 18,600 tenured renters. Participants were allowed to take more than one survey. The study was fielded between March and July 2025.
For the purpose of this study, “renters” refers to household decision makers 18 years of age or older who rent their primary residence. “Recent renters” refer to those that moved in the past year, and “tenured renters” refer to those who did not move in the past year.
Results from this survey are nationally representative of renter households. US adult decision makers who live in a rented home were identified from online nonprobability samples. To achieve representativeness, we used a combination of quota sampling and statistical raking using benchmarks estimated from the 2023 American Community Survey (ACS) and the 2024 Current Population Survey Annual and Economic Supplement (CPS ASEC).
To reduce response bias, survey respondents did not know that Zillow Group was conducting the survey. Several additional quality control measures were also taken to ensure data accuracy:
Unless otherwise specified, estimates in this report come from the Consumer Housing Trends Report (CHTR) 2025, and year-over-year comparisons also use data from CHTR 2018, CHTR 2019 CHTR 2020, CHTR 2021, CHTR 2022, CHTR 2023, CHTR 2024, and supplemental renter surveys. To provide a fuller picture of the state of home rentals and renters’ characteristics, preferences and behaviors, we also analyzed data from other sources:
| Recent renters best concession | Top 1 | Among top 2 |
| Reduced rent | 27% | 46% |
| First month rent free | 17% | 34% |
| More than first month rent free | 15% | 29% |
| Free/discounted access to paid property amenities (laundry, internet, etc…) | 8% | 22% |
| Reduced security deposit | 8% | 21% |
| Parking | 6% | 17% |
| Gift card | 2% | 4% |
| Broker’s fee paid | 1% | 4% |
| Something else | 16% | 22% |
The features we asked about and their essential percentages are:
| % of Recent Renters that consider each “essential” when deciding which home to rent | |
| Drone capture of the exterior | 13% |
| Virtual staging to visualize the home with different furniture (i.e. augmented reality) | 33% |
| Interactive 3D tours of common areas (e.g. fitness center, resident lounge, etc) | 29% |
| None of the above | 43% |
| Net: Any | 57% |
Parents and other family members are the most common cosigners, while the majority of renters (72% of recent movers and 75% overall) do not have a cosigner on their lease.
| Lease Cosigners | Recent Renters | Tenured Renters | All Renters |
| My parents cosigned or were guarantors on my lease | 9% | 9% | 9% |
| Another family member cosigned or was a guarantor on my lease | 8% | 7% | 7% |
| A friend or colleague cosigned or was a guarantor on my lease | 2% | 3% | 2% |
| A roommate cosigned or was a guarantor on my lease | 7% | 4% | 4% |
| Someone else not listed above cosigned or was a guarantor on my lease | 3% | 2% | 3% |
| No one cosigned or was a guarantor on my lease | 72% | 76% | 75% |
| Net: Any Cosigner | 28% | 24% | 25% |
31% of recent renters reported paying a pet fee or pet rent (49% among those with a pet – 51% for dog owners and 45% for cats), as do 24% of renters overall (39% of those with a pet – 41% with dogs and 37% with cats).
Among recent renters that pay any pet fee/pet rent:
| Pet Fee/Pet Rent Amount | Total Renters | Recent | Tenured |
| $1 to $19 | 7% | 4% | 8% |
| $20 to $39 | 28% | 25% | 29% |
| $40 to $59 | 36% | 45% | 33% |
| $60 to $99 | 12% | 14% | 12% |
| $100 or more | 17% | 12% | 18% |
Share of recent renters that initially hoped to rent a home with (select-all-that-apply or none at all, may not sum to 100%):
Ultimately rented:
Most recent renters end up renting a home with the number of bedrooms they initially hoped for, especially for 2-bedroom (73%) units.
| Initially hoped to rent | |||||||
| Recent renters | 0 beds – Studio | 1 | 2 | 3 | 4 | 5+ | |
| Actually Rented | 0 bedrooms – Studio | 69% | 13% | 2% | 1% | 0% | 0% |
| 1 bedroom | 14% | 69% | 11% | 3% | 1% | 0% | |
| 2 bedrooms | 6% | 10% | 73% | 21% | 7% | 1% | |
| 3 bedrooms | 5% | 4% | 11% | 66% | 28% | 13% | |
| 4 bedrooms | 2% | 2% | 2% | 8% | 58% | 17% | |
| 5 or more bedrooms | 4% | 2% | 1% | 1% | 6% | 69% | |
In this section, we provide a high-level overview of renters and what their homes look like. According to the Census Bureau 2023 American Community Survey, 35% of households live in rented homes. About a fifth of those rental households (22%) moved in the past year.
The demographic estimates in this section for “renters” and “renter households” represent the rental household decision makers (head of household, their spouse/partner, and roommates). In cases where a household has multiple decision makers, the demographic characteristics are representative of an average or midpoint of all decision makers in the rental household.
The median age of a renter is 41 years old and about half of renters are under the age of 40; only 9% of renters are in their seventies or older, and 13% are in their sixties. In other words, the age distribution of renters trends younger than the overall US population. Renters who did not move in the last year trend older than those who did move. The median age for a tenured renter is 43 years old — a decade older than the typical renter who moved (33 years old)
| Age Group | Recent Renters | All Renters (including those that did not move) | Household Decision Makers | US Adults |
| Ages 18-29 | 41% | 24% | 11% | 20% |
| Ages 30-39 | 24% | 23% | 18% | 18% |
| Ages 40-49 | 15% | 18% | 17% | 16% |
| Ages 50-59 | 9% | 12% | 17% | 16% |
| Ages 60-69 | 8% | 13% | 18% | 16% |
| Ages 70+ | 4% | 9% | 20% | 15% |
Note: Household decision maker and US adult estimates from Census Bureau, 2024 Current Population Survey Annual Social and Economic Supplement
| Generation | Recent Renters | All Renters |
Household Decision Makers | US Adults |
| Gen Z (18-30) | 44% | 26% | 11% | 20% |
| Millennial (31-45) | 32% | 33% | 26% | 26% |
| Gen X (46-60) | 14% | 20% | 25% | 23% |
| Baby Boomer (61-80) | 9% | 20% | 31% | 26% |
| Silent Generation (81+) | 1% | 1% | 7% | 5% |
Note: Household decision maker and US adult estimates from Census Bureau, 2024 Current Population Survey Annual Social and Economic Supplement
About half of renters are non-Hispanic white or Caucasian (49%), smaller than the share of the overall adult population that is white (60%). At the same time, 12% of adults identify as non-Hispanic Black or African American, while 19% of renters are Black.
| Race/ Ethnicity | Recent Renters | All Renters |
Household Decision Makers | US Adults |
| White or Caucasian | 52% | 49% | 63% | 60% |
| Black or African American | 16% | 19% | 12% | 12% |
| Hispanic | 19% | 21% | 15% | 18% |
| Asian or Pacific Islander | 7% | 6% | 6% | 6% |
| Other race | 6% | 5% | 4% | 5% |
Note: Household decision maker and US adult estimates from Census Bureau, 2023 American Community Survey
The largest share of renters live in the South (37%), followed by the West (25%), Midwest (19%) and Northeast (19%).
| Region | Recent Renters | All Renters |
Household Decision Makers |
US Adults |
| South | 42% | 37% | 39% | 39% |
| West | 25% | 25% | 22% | 24% |
| Midwest | 21% | 19% | 21% | 20% |
| Northeast | 12% | 19% | 17% | 17% |
Note: Household decision maker and US adult estimates from Census Bureau, 2024 Current Population Survey Annual Social and Economic Supplement
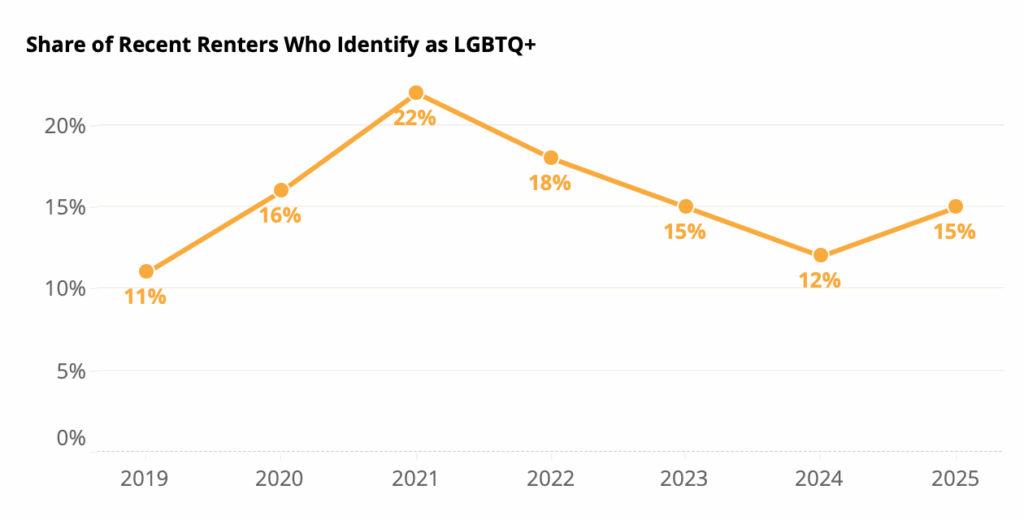
| Approximately 12% of renters identify as LGBTQ+ in 2025 |
Recent renters are more likely to identify as LGBTQ+ (15%) than tenured renters (12%) or renters as a whole (12%).
Younger renters are more likely to self-identify as LGBTQ+: The median age of an LGBTQ+ renter is 34 versus 42 for cisgender heterosexual renters. Renters trending younger than the overall US adult population may help explain why renters are also more likely to identify as LGBTQ+.
Renters tend to have lower incomes than the population overall. The annual median income among renter households is about $54,000, compared to the approximate national median of $80,000.
| Household Income | Recent Renter Households | All Renter Households | All US Households |
| Less than $25k | 22% | 25% | 14% |
| $25,000 to $49,999 | 24% | 25% | 17% |
| $50,000 – $74,999 | 19% | 18% | 16% |
| $75,000 – $99,999 | 12% | 12% | 12% |
| $100,000 to $199,999 | 17% | 16% | 26% |
| $200k and above | 5% | 4% | 14% |
Source: All US household estimates from Census Bureau, 2024 Current Population Survey Annual Social and Economic Supplement
Renters as a whole tend to have a lower level of education to the overall adult population: Only 32% of renters have at least a four-year degree, lower than 35% of overall adults. Recent renters, however, are similarly likely to the overall adult population to have at least a four-year degree (38%).
| Education | Recent Renters | All Renters | Household Decision Makers |
US Adults |
| High School Diploma or Less | 36% | 42% | 34% | 38% |
| Some College | 26% | 27% | 27% | 26% |
| Four-year College Degree | 26% | 21% | 24% | 22% |
| Postgraduate | 12% | 10% | 15% | 13% |
Source: Household decision maker and US adult estimates from Census Bureau, 2024 Current Population Survey Annual Social and Economic Supplement
Skewing younger than the adult population, renter households are less likely to be married or partnered. The largest share (41%) are single and never married, versus 25% of adults overall. This difference in relationship status may provide a partial explanation for the lower household income of renters compared with the overall population.
| Relationship Status | Recent Renters | All Renters | Household Decision Makers |
US Adults |
| Never Married | 37% | 41% | 20% | 25% |
| Married | 38% | 30% | 56% | 60% |
| Divorced, Separated, or Widowed | 25% | 29% | 24% | 16% |
Source: Household decision maker and US adult estimates from Census Bureau, 2024 Current Population Survey Annual Social and Economic Supplement
Renter households are more likely to report having at least one pet (59%) or plant (46%) than a child (37%).
| In Household | Recent Renter Households | Tenured Renter Households | All Renter Households | All Households | |
| Children under 18 | 35% | 37% | 37% | 36% | |
| Plant | 44% | 47% | 46% | – | |
| Dog | 40% | 40% | 40% | 38% | |
| Cat | 30% | 32% | 31% | 22% | |
| Another pet | 9% | 10% | 10% | 10% | |
| NET: Any pet | 58% | 59% | 59% | 50% | |
Apartments of various sizes are what most renters call home: 56% of renters report living in an apartment building. About one in four renters (23%) say they rent in a smaller-size apartment or condo building (fewer than 25 units). About one in eight (12%) said they live in a medium-size building (25-49 units), and 21% said they live in a larger multifamily building (50 units or more). In other words, about 32% of renters live in a multifamily building with at least 25 units. About 27% live in a single-family detached house.
| Home Type | Share of Renters |
| Apartment in a smaller size building (fewer than 25 units) | 23% |
| Apartment in a medium size building (25-49 units) | 13% |
| Apartment in a larger size building (50 units or more) | 19% |
| Single-family detached house | 28% |
| Townhouse / rowhouse | 8% |
| Duplex / triplex | 6% |
| Manufactured / mobile home | 3% |
| Room in shared housing | <1% |
| Boat, RV, van, etc. | <1% |
The typical (median) renter lives in a 2-bed, 1-bath apartment between 1,000 and 1,499 square feet.
| Size | Share of Renters |
| Less than 700 square feet | 14% |
| 700 – 999 square feet | 28% |
| 1,000 – 1,499 square feet | 30% |
| 1,500 – 1,999 square feet | 17% |
| 2,000 – 2,499 square feet | 7% |
| 2,500 square feet or more | 3% |
Most recent renters moved from a previous rental (68%). Living with a friend or family member (16%) is more common for younger recent renters. For example, about one in four (24%) recent renters under age 30 reported moving from a home that a friend or family member rented or owned. Conversely, moving from a home they owned is more common for older recent renters; about a quarter (23%) of recent renters age 70 and older reported moving from a home they owned, versus 8% for recent renters overall. A small 2% said they moved from group living quarters (e.g. dormitory, military barracks, nursing home, etc.), and the remaining 7% reported another type of living situation.
| Recent renter previous primary residence | 2018 | 2019 | 2020 | 2021 | 2022 | 2023 | 2024 | 2025 |
| Owned | 10% | 9% | 9% | 11% | 7% | 8% | 8% | 8% |
| Rented | 70% | 73% | 73% | 63% | 67% | 67% | 66% | 68% |
| Lived with friend/family | 14% | 13% | 13% | 18% | 18% | 17% | 18% | 16% |
| Group quarters | 2% | 1% | 1% | 2% | 2% | 2% | 2% | 2% |
| Another living situation | 4% | 4% | 3% | 5% | 6% | 6% | 7% | 7% |
Among recent renters that moved from a previous rental:
| Moved from (previous residence) | ||||||
| <25 Unit Building | 25-49 Unit Building | 50+ Unit Building | Single Family Detached House | Other | ||
| Moved to
(current residence) |
<25 Unit Building | 53% | 17% | 6% | 11% | 12% |
| 25-49 Unit Building | 10% | 43% | 9% | 8% | 11% | |
| 50+ Unit Building | 13% | 13% | 62% | 19% | 13% | |
| Single Family Detached House | 15% | 12% | 18% | 50% | 20% | |
| Other | 9% | 14% | 6% | 13% | 45% | |
The typical (median) recent renter submitted two applications. The median application fee for recent renters overall was $50. Among those that reported paying any application fee, the median amount was $75.
Since at least 2018, the share of renters that reported submitting an application in-person/on paper has fallen. Over the same period, online applications became more common.
| Recent renters | 2018 | 2019 | 2020 | 2021 | 2022 | 2023 | 2024 | 2025 |
| Online application | 51% | 54% | 63% | 67% | 69% | 75% | 74% | 77% |
| In-person/paper application | 71% | 69% | 67% | 62% | 62% | 61% | 56% | 51% |
A $50 median application fee is the same as previous years. However, the share that reported paying an application fee peaked in 2023 at 84% – falling to 79% in 2024 and 73% in 2025.
Across racial groups, paying an application fee is more common than not, but renters of color are more likely to report paying one: Larger shares of Black (84%), Asian American/Pacific Islander (80%), and Hispanic (78%) recent renters reported paying an application fee than white recent renters (67%).
Black and Hispanic renters were also about twice as likely as their non-hispanic white counterparts to report submitting 5 applications or more (19% of Black and 16% of Hispanic recent renters reported submitting 5 or more, compared to 8% of white renters).
Recent renters of color also reported paying higher total amounts in application fees: The typical white renter reported paying $50 in application fees across all the rentals they applied for, while the typical Black ($70), Latinx ($100), and Asian ($95) recent renters all reported spending higher amounts.
| Recent Renters that Submitted | 2018 | 2019 | 2020 | 2021 | 2022 | 2023 | 2024 | 2025 |
| 0 applications | 14% | 13% | 12% | 14% | 11% | 13% | 14% | 20% |
| 1 application | 36% | 38% | 31% | 25% | 32% | 21% | 25% | 23% |
| 2+ applications | 50% | 50% | 56% | 61% | 57% | 66% | 62% | 57% |
Renters in large multifamily buildings (those with 50 units or more) were most likely to report submitting at least one application: 93% do, compared with 66% of those in single-family detached houses and 76% of those renting other home types.
For renters who paid one, the typical security deposit reported in 2025 was $795.
The oldest generations of recent renters are the most likely to avoid paying a deposit entirely: 79% of Gen X and Baby Boomer & SIlent Generation renters reported paying a security deposit — lower than 83% of Gen Z and 86% of Millennial recent renters.
| Generation | Share that Paid a Security Deposit |
| Recent Renters | 83% |
| Gen Z (Ages 18-30) | 83% |
| Millennial (Ages 31-45) | 86% |
| Gen X (Ages 46-60) | 79% |
| Baby Boomers & Silent Generation (Ages 61+) | 79% |
| Age Group | Share that Paid a Security Deposit |
| Recent Renters | 83% |
| Ages 18-29 | 83% |
| Ages 30-39 | 86% |
| Ages 40-49 | 85% |
| Ages 50-59 | 77% |
| Ages 60+ | 80% |
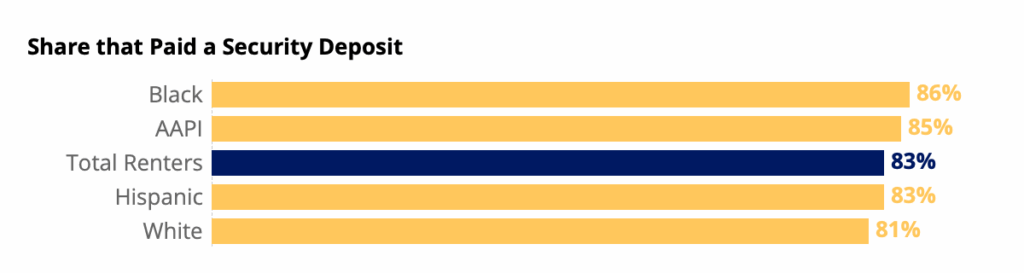
Renters of color are more likely to report paying a security deposit: 87% do, compared to 84% of white renters. Latinx and Asian American/Pacific Islander renters are more likely to pay a more expensive deposit: 39% of Latinx and 43% of AAPI renters paid at least $500 for their deposit, and 22% of Latinx and 30% of AAPI renters paid at least $1,000.
| Race/ Ethnicity | Paid Any Security Deposit | Deposit of At Least $500 | Deposit of At Least $1,000 |
| Total Renters | 83% | 37% | 21% |
| White | 81% | 32% | 18% |
| Black | 86% | 35% | 19% |
| Hispanic | 83% | 45% | 26% |
| AAPI | 85% | 50% | 37% |
| Net: Nonwhite | 84% | 41% | 24% |
Regardless of the type of home rented, paying a deposit is the norm: 83% of recent renters reported paying one – closely matching 83% of renters overall.
| Type of Home Rented | Median Security Deposit | Median Among Renters Who Paid One | Average Security Deposit | Average Among Renters Who Paid One |
| Recent Renters | $795 | $800 | $1,324 | $1,603 |
| Multifamily (50+ units) | $500 | $1,000 | $973 | $1,150 |
| Single-family detached | $750 | $1,200 | $2,300 | $3,018 |
| Other | $800 | $950 | $976 | $1,150 |
| Type of Home Rented | Paid Any Security Deposit | Paid At Least $500 | Paid At Least $1,000 |
| Recent Renters | 83% | 35% | 20% |
| Multifamily (50+ units) | 87% | 31% | 19% |
| Single-family detached | 78% | 43% | 26% |
| Other | 85% | 32% | 18% |
About three quarters of renters (73%) said that paying their first month’s rent was required to secure their rental. However, only a quarter (24%) said they had to pay their last month’s rent to secure their rental.
Requiring last month’s rent, however, was disproportionately common for AAPI and Hispanic recent renters, and less common for Black and White renters.
| Required to secure rental | ||
| Race/ Ethnicity | First month’s rent | Last month’s rent |
| Recent Renters | 73% | 24% |
| White | 70% | 21% |
| Black | 66% | 19% |
| Hispanic | 79% | 33% |
| AAPI | 76% | 32% |
| Net: Nonwhite | 75% | 28% |
Renters of color, particularly AAPI and Hispanic renters, are more likely to report paying at least one recurring fee compared to White renters. There’s also a general upward trend in the reported frequency of paying recurring fees from 2024 to 2025.
| Report paying 1+ recurring fee | Total Renters | White | Black | Hispanic | AAPI | Nonwhite |
| 2025 – Including pet fee | 65% | 63% | 64% | 66% | 74% | 67% |
| 2025 – Excluding pet fee | 60% | 58% | 61% | 60% | 72% | 63% |
| 2024 – Excluding pet fee | 58% | 54% | 60% | 63% | 63% | 61% |
| Report paying 1+ recurring fee | Total Renters | 18-29 | 30-39 | 40-49 | 50-59 | Age 60+ |
| 2025 – Including pet fee | 65% | 82% | 76% | 64% | 56% | 42% |
| 2025 – Excluding pet fee | 60% | 78% | 72% | 58% | 49% | 39% |
| 2024 – Excluding pet fee | 58% | 58% | 74% | 67% | 59% | 48% |
| Recent renters pay | 2024 | 2025 |
| Pet fee/pet rent |
– |
31% |
| Valet trash | 23% | 13% |
| Utility fee | 52% | 55% |
| Amenity fee | 22% | 24% |
| Internet fee | 26% | 29% |
| Payment processing fee | 37% | 33% |
| At least 1 – Excl pet fee | 70% | 74% |
| At least 1 – Incl pet fee |
– |
77% |
| Total renters pay | 2024 | 2025 |
| Pet fee/pet rent |
– |
24% |
| Valet trash | 18% | 12% |
| Utility fee | 41% | 44% |
| Amenity fee | 16% | 18% |
| Internet fee | 20% | 25% |
| Payment processing fee | 27% | 26% |
| At least 1 – Excl pet fee | 58% | 60% |
| At least 1 – Incl pet fee |
– |
65% |
Nearly all renters (94%) agree that rental listings should clearly list all fees. About nine in ten (90%) think that renters should be able to opt out of fees for services they do not use. And 76% said that rental fees should be included in the total rent, rather than charged separately.
The share of recent renters who say they searched on a mobile website increased in 2025: (81% in 2025, 75% in 2024, 74% in 2023 & 2022, and 2021, up from 65% in 2020) and/or on a mobile app (73% in 2025, 64% in 2024, 63% in 2023, 60% in 2022 & 2021, up from 51% in 2020).
| Online resources recent renters used when searching | 2019 | 2020 | 2021 | 2022 | 2023 | 2024 | 2025 |
| Website on a laptop / desktop computer | 70% | 72% | 73% | 67% | 68% | 68% | 66% |
| Mobile website on a smartphone / tablet | 64% | 65% | 74% | 74% | 74% | 75% | 81% |
| App on a smartphone / tablet | 46% | 51% | 60% | 60% | 63% | 64% | 73% |
| Number of sites/apps recent renters used when searching | 2019 | 2020 | 2021 | 2022 | 2023 | 2024 | 2025 |
| 0 sites/apps | 16% | 13% | 11% | 10% | 9% | 11% | 5% |
| 1-4 sites/apps | 26% | 25% | 28% | 39% | 35% | 37% | 33% |
| 5-9 sites/apps | 34% | 36% | 37% | 34% | 34% | 35% | 35% |
| 10+ | 24% | 26% | 23% | 16% | 22% | 16% | 27% |
| Median number of sites/apps used | 5 | 6 | 6 | 5 | 5 | 5 | 5 |
| Average | 6.26 | 6.2 | 6.4 | 5.5 | 6.1 | 5.5 | 4.8 |
About four in five renters (79%) said that one or more digital features was “essential” when deciding which home to rent. Half (50%) considered seeing pictures essential. Seeing a floor plan (40%) followed. Renters were less likely to say the same about taking a 3D/virtual tour of the rental home (27%) and watching a recorded video tour of the home (22%).
| Total Renters | 2024 | 2025 |
| Taking a 3D/Virtual tour of the rental home | 25% | 27% |
| Watching a recorded video tour of the home | 20% | 22% |
| Seeing a floor plan of the home | 49% | 40% |
| Viewing pictures of the home | 56% | 50% |
| Net: At least one of the above is essential | 79% | 79% |
| Recent Renters | 2024 | 2025 |
| Taking a 3D/Virtual tour of the rental home | 27% | 30% |
| Watching a recorded video tour of the home | 23% | 25% |
| Seeing a floor plan of the home | 55% | 47% |
| Viewing pictures of the home | 61% | 55% |
| Net: At least one of the above is essential | 87% | 86% |
| Recent Renters | Total | SF | MF (50+ unit building) | Any apartment |
| Taking a 3D/Virtual tour of the rental home | 30% | 29% | 38% | 33% |
| Watching a recorded video tour of the home | 25% | 21% | 31% | 28% |
| Seeing a floor plan of the home | 47% | 36% | 62% | 50% |
| Viewing pictures of the home | 55% | 57% | 56% | 52% |
| Net: At least one of the above is essential | 86% | 81% | 91% | 88% |
About three in five recent renters (59%) said that seeing lease terms, rent amount and fees were essential. And 55% said the same about taking a private tour. Recent renters were more split about meeting or speaking with the landlord or property manager (47%) and about a third (37%) said that seeing reviews of the property manager / landlord was essential.
When asked what encouraged them to stay at their current rental, tenured renters were most likely to say that their rental costs were a good deal (75%), followed by quiet neighbors (71%) and not being able to afford to move somewhere else (69%).
| Tenured renters – Reason for staying at current rental | |
| My rental costs are a good deal | 75% |
| Neighbors are quiet, little to no noise from other tenants | 71% |
| I cannot afford to move somewhere else | 69% |
| Rental property is well maintained | 68% |
| I like my landlord or property manager | 65% |
| Floor plan / layout fits my preferences | 65% |
| Allows pets | 62% |
| Private outdoor space (e.g. yard, garden) | 56% |
| My rental’s common amenities (e.g. gym, conference room, pet washing station, rooftop, etc) | 41% |
Less than half of tenured renters said that their rent has stayed the same (41%) or decreased (3%) over the past two years. For the majority that reported an increase (57%), those that stayed put experienced a median rent increase of $130 – about a 12% increase.
Younger tenured renters and those renting single-family detached houses typically reported higher percent rent increases:
Most recent renters (77%) said they considered a spouse, partner, roommate, friend, relative/family member, their children, and/or someone else as a co-shopper while they searched for a rental.
Younger renters (81% of recent renters under 30, 79% of renters in their 30s), higher income renters (87% of recent renters with a household income of at least $100,000), and single-family renters (84%) were all more likely to report at least one co-shopper.
| Coshopped with | Recent Renters | Single- family detached house | Multifamily (in 50+ unit building) | Another type of home |
| Spouse/partner | 44% | 50% | 43% | 42% |
| Roommates | 10% | 8% | 9% | 12% |
| Friends | 9% | 7% | 11% | 9% |
| Relatives/family members | 14% | 17% | 14% | 13% |
| My children | 17% | 20% | 19% | 15% |
| Someone else not listed above | 2% | 1% | 2% | 2% |
| None of the above – I did not co-shop with anyone | 23% | 16% | 24% | 26% |
| Net: Any co-shopper | 77% | 84% | 76% | 74% |
A near-unanimous share of renters (93%) said they consider staying within their initial budget as “essential” – higher than any other characteristic we asked about. Preferred neighborhood/location (81%), preferred number of bedrooms (81%), bathrooms (69%), and floor plan/layout (66%) all trailed. Most also said that broadband internet was essential (64%), while closer to half (56%) said the same about gigabit internet speeds. A smaller share (47%) said that having 2 or more internet providers to choose from was essential.
| Consider each “essential” when deciding whether to rent a property | Total Renters | Single- family detached house | Multifamily (in 50+ unit building) | Another type of home |
| Within my initial budget | 93% | 95% | 93% | 93% |
| Preferred neighborhood and/or location | 81% | 81% | 84% | 79% |
| Preferred number of bedrooms | 81% | 84% | 79% | 83% |
| Preferred number of bathrooms | 69% | 73% | 70% | 68% |
| Floor plan / layout that fits my preferences | 66% | 65% | 70% | 64% |
| Allows pets | 65% | 73% | 61% | 70% |
| Broadband internet | 64% | 62% | 68% | 62% |
| Gigabit internet | 56% | 56% | 56% | 59% |
| 2 or more internet providers to choose from | 47% | 47% | 46% | 47% |
| Home is newly built or recently renovated | 43% | 37% | 46% | 43% |
| Common building amenities (e.g. gym, business center, rooftop, lounge, etc) | 39% | 35% | 49% | 35% |
| Total Renters – Consider each “essential” when deciding whether to rent a property | 2023 | 2024 | 2025 |
| Within my initial budget | 94% | 95% | 93% |
| Preferred neighborhood and/or location | 83% | 83% | 81% |
| Preferred number of bedrooms | 84% | 82% | 81% |
| Preferred number of bathrooms | 67% | 65% | 69% |
| Floor plan / layout that fits my preferences | 68% | 67% | 66% |
| Allows pets |
|
60% | 65% |
| Broadband internet | 63% | 63% | 64% |
| Gigabit internet | 52% | 51% | 56% |
| 2 or more internet providers to choose from | 44% | 43% | 47% |
| Home is newly built or recently renovated | 41% | 38% | 43% |
| Common building amenities (e.g. gym, business center, rooftop, lounge, etc) | 35% | 33% | 39% |
| Recent Renters – Consider each “essential” when deciding whether to rent a property | 2023 | 2024 | 2025 |
| Within my initial budget | 94% | 94% | 93% |
| Preferred neighborhood and/or location | 80% | 83% | 82% |
| Preferred number of bedrooms | 84% | 82% | 81% |
| Preferred number of bathrooms | 69% | 66% | 69% |
| Floor plan / layout that fits my preferences | 70% | 66% | 67% |
| Allows pets |
|
62% | 67% |
| Broadband internet | 61% | 61% | 62% |
| Gigabit internet | 54% | 53% | 59% |
| 2 or more internet providers to choose from | 43% | 38% | 46% |
| Home is newly built or recently renovated | 45% | 39% | 44% |
| Common building amenities (e.g. gym, business center, rooftop, lounge, etc) | 39% | 37% | 44% |
| Consider each “essential” when deciding whether to rent a property | Recent Renters | Single- family detached house | Multifamily (in 50+ unit building) | Another type of home |
| Within my initial budget | 93% | 94% | 95% | 96% |
| Preferred neighborhood and/or location | 82% | 80% | 84% | 85% |
| Preferred number of bedrooms | 81% | 83% | 81% | 85% |
| Preferred number of bathrooms | 69% | 72% | 71% | 69% |
| Floor plan / layout that fits my preferences | 67% | 74% | 60% | 71% |
| Allows pets | 67% | 69% | 73% | 60% |
| Broadband internet | 62% | 66% | 63% | 64% |
| Gigabit internet | 59% | 62% | 55% | 62% |
| 2 or more internet providers to choose from | 46% | 47% | 41% | 53% |
| Home is newly built or recently renovated | 44% | 36% | 54% | 42% |
| Common building amenities (e.g. gym, business center, rooftop, lounge, etc) | 44% | 39% | 45% | 48% |
Recent renters were most likely to place high importance on their commute (57%) and neighborhood walkability (55%).
| Share of Recent Renters that Consider each Neighborhood Characteristic Very or Extremely Important | 2018 | 2019 | 2020 | 2021 | 2022 | 2023 | 2024 | 2025 |
| Close to family and/or friends | 36% | 37% | 38% | 39% | 37% | 39% | 39% | 43% |
| Close to shopping, services, and/or leisure activities | 47% | 50% | 51% | 49% | 49% | 56% | 53% | 53% |
| Close to public transportation | 36% | 35% | 34% | 31% | 33% | 37% | 33% | 37% |
| My commute to work or school | 58% | 57% | 55% | 52% | 56% | 59% | 56% | 57% |
| In a walkable neighborhood | 55% | 56% | 55% | 56% | 57% | 61% | 55% | 55% |
| Offered a sense of community or belonging | 33% | 34% | 34% | 35% | 39% | 42% | 39% | 43% |
Most recent renters (56%) included an apartment among the type of home they initially hoped to rent, followed by about a third (34%) who included a single-family detached house. Townhouses (10%), du/tri/fourplexes (7%), and another type of home (4%) followed.
Most renters who hoped to rent a single-family detached house (68%) ended up renting one, and the trend of renting what they hoped for is consistent for most home types: 74% of renters who hoped for an apartment in a large building got one, for example.
| Recent renters | Type of home recent renters initially hoped to rent | ||||||
| Type of home they rented | Apartment in small building | Apartment in medium building | Apartment in large building | Single- family detached house | Townhouse / rowhouse | Du/tri/ fourplex | Another type of home |
| Apartment in small building | 65% | 21% | 6% | 4% | 6% | 5% | 8% |
| Apartment in medium building | 9% | 48% | 10% | 6% | 8% | 8% | 7% |
| Apartment in large building | 10% | 18% | 74% | 11% | 14% | 15% | 8% |
| Single-family detached house | 8% | 6% | 5% | 68% | 12% | 4% | 42% |
| Townhouse / rowhouse | 4% | 4% | 3% | 4% | 51% | 15% | 3% |
| Duplex / Triplex | 3% | 2% | 1% | 4% | 7% | 51% | 13% |
| Manufactured / mobile home | 1% | 1% | 1% | 3% | 1% | 2% | 14% |
| Boat, RV, van, etc. | 0% | 0% | 0% | 0% | 0% | 0% | 4% |
A majority (64%) of recent renters reported at least thinking about buying during their rental search. A quarter of recent renters (25%) said they seriously considered buying.
| Recent renter homebuying consideration | 2018 | 2019 | 2020 | 2021 | 2022 | 2023 | 2024 | 2025 |
| Never considered buying | 54% | 51% | 45% | 44% | 34% | 36% | 42% | 36% |
| Seriously considered buying instead | 19% | 21% | 24% | 23% | 24% | 26% | 22% | 25% |
| Thought about buying, more serious about renting | 27% | 27% | 31% | 34% | 42% | 38% | 36% | 38% |
| NET: Considered buying | 46% | 49% | 55% | 56% | 66% | 64% | 58% | 64% |
| Recent Renter Move Consideration | 2018 | 2019 | 2020 | 2021 | 2022 | 2023 | 2024 | 2025 |
| No plans to move | 20% | 20% | 19% | 17% | 15% | 15% | 27% | 21% |
| Might consider moving, but not within next 3 years | 12% | 14% | 12% | 14% | 12% | 12% | 15% | 14% |
| Considering moving in the next 2-3 years | 22% | 20% | 23% | 24% | 19% | 19% | 17% | 19% |
| Considering moving in the next year | 22% | 23% | 26% | 21% | 31% | 29% | 23% | 24% |
| Currently considering moving | 24% | 24% | 20% | 24% | 19% | 25% | 18% | 22% |
| Net: Considering in next 3 years | 68% | 67% | 69% | 59% | 73% | 72% | 58% | 66% |
| Net: Any consideration | 80% | 80% | 81% | 70% | 81% | 85% | 73% | 79% |
Among recent renters who intend to move within the next year, most (59%) say they plan to continue renting.
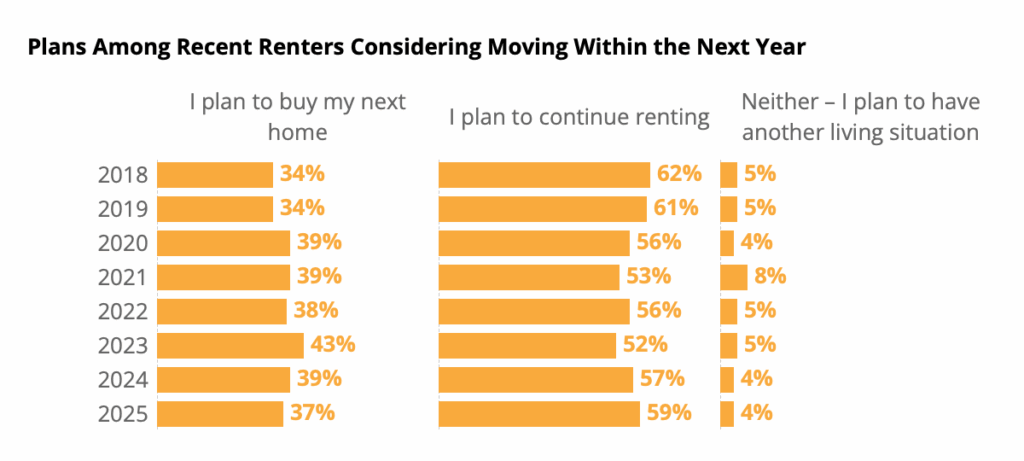
| Among Recent Renters Considering Moving Within the Next Year | 2018 | 2019 | 2020 | 2021 | 2022 | 2023 | 2024 | 2025 |
| I plan to continue renting | 62% | 61% | 56% | 53% | 56% | 52% | 57% | 59% |
| I plan to buy my next home | 34% | 34% | 39% | 39% | 38% | 43% | 39% | 37% |
| Neither – I plan to have another living situation | 5% | 5% | 4% | 8% | 5% | 5% | 4% | 4% |
Not quite half (42%) of renters say that they would be very or extremely likely to buy a home if rates fell, versus half that (21%) who say the same if rates rise.
| Buy if rates fall | 2023 | 2024 | 2025 |
| Extremely likely | 23% | 19% | 20% |
| Very likely | 22% | 18% | 22% |
| Somewhat likely | 25% | 26% | 25% |
| Not very likely | 13% | 17% | 14% |
| Not at all likely | 16% | 20% | 18% |
| Net: Very/Extremely Likely | 45% | 37% | 42% |
| Net: Not very/not at all likely | 29% | 37% | 33% |
| Buy if rates rise | 2023 | 2024 | 2025 |
| Extremely likely | 9% | 6% | 9% |
| Very likely | 11% | 7% | 12% |
| Somewhat likely | 20% | 18% | 19% |
| Not very likely | 27% | 30% | 27% |
| Not at all likely | 32% | 38% | 33% |
| Net: Very/Extremely Likely | 21% | 13% | 21% |
| Net: Not very/not at all likely | 59% | 69% | 60% |
About two thirds of renters (69%) say they are considering moving in the next three years, or might consider moving but are not sure when. For this group, about half (56%) say they intend to save up enough for a down payment or to buy a home outright. Smaller shares say they intend to save up for a large purchase (26%) like a car, computer or vacation. Only one in ten (11%) said they intend to pair up with a spouse or partner before their next move.
The typical recent renter surveyed in 2025 reported taking only one in-person tour. Going on at least two in-person tours is still quite common, however: 45% of recent renters reported taking at least two. Only about one in five (22%) recent renters forewent in-person tours entirely.
| Share of Recent Renters that Reported Taking | 2018 | 2019 | 2020 | 2021 | 2022 | 2023 | 2024 | 2025 |
| 0 In-Person Tours | 21% | 19% | 18% | 23% | 23% | 19% | 19% | 22% |
| 1-4 In-Person Tours | 62% | 63% | 67% | 68% | 71% | 74% | 73% | 68% |
| 5 or More In-Person Tours | 16% | 17% | 15% | 10% | 6% | 8% | 9% | 10% |
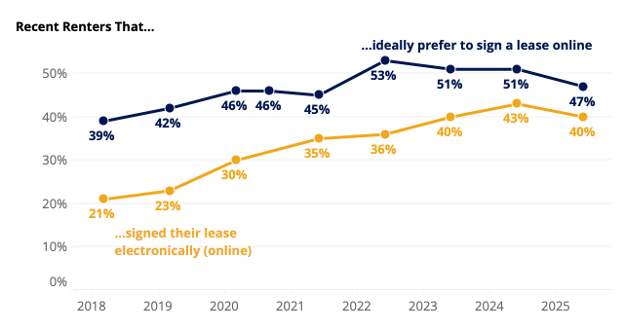
While the share of recent renters that signed their lease electronically stayed largely unchanged between 2018 and 2019 (21% and 23% respectively), 2020 saw a substantial increase to 30%, and the trend continued in 2021, when 35% of recent renters reported signing their leases electronically. In 2022, 36% of recent renters reported signing electronically – similar to 2021. 2023 saw that number increase to 40%, peaking at 43% in 2024, then returning to 40% in 2025. In-person leases are still the norm for a slim majority of recent renters (52%), but have been on a downward trend.
| Recent Renters who signed their lease… | 2018 | 2019 | 2020 | 2021 | 2022 | 2023 | 2024 | 2025 |
| In-person (on paper) | 72% | 72% | 66% | 56% | 55% | 52% | 51% | 52% |
| Electronically (online) | 21% | 23% | 30% | 35% | 36% | 40% | 43% | 40% |
| We did not sign the lease | 7% | 5% | 5% | 9% | 8% | 8% | 7% | 8% |
About half (52%) of recent renters said they signed their lease on paper. A slightly smaller share (47%) said they would ideally prefer to sign a lease electronically.
| Spring | Fall | Spring & Summer | |||||||
| Ideally prefer to do each online | 2018 | 2019 | 2020 | 2020 | 2021 | 2022 | 2023 | 2024 | 2025 |
| Apply for a rental | 59% | 58% | 58% | 65% | 60% | 65% | 67% | 67% | 62% |
| Sign a Lease | 39% | 42% | 46% | 46% | 45% | 53% | 51% | 51% | 47% |
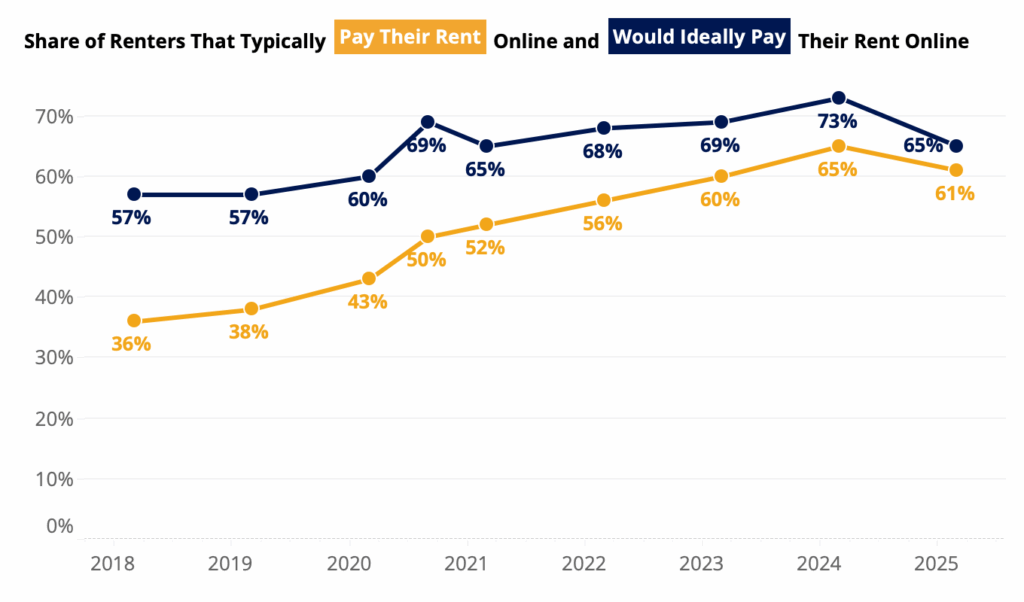
In fall of 2020, half (50%) of recent renters said they typically paid their rent online. Since then, the share has risen 15 points to 65%. Almost three quarters (73%) of recent renters say they would ideally pay their rent online.
| Recent Rs | Spring | Fall | Spring & Summer | ||||||
| Typically pay their rent… | 2018 | 2019 | 2020 | 2020 | 2021 | 2022 | 2023 | 2024 | 2025 |
| In person | 49% | 48% | 43% | 41% | 38% | 37% | 34% | 29% | 36% |
| Online | 36% | 38% | 43% | 50% | 52% | 56% | 60% | 65% | 61% |
| Through the mail | 9% | 8% | 9% | 7% | 6% | 4% | 4% | 2% | 3% |
| Other | 6% | 6% | 5% | 3% | 3% | 3% | 3% | 3% | 3% |
| Recent Rs | Spring | Fall | Spring & Summer | ||||||
| Would ideally pay their rent… | 2018 | 2019 | 2020 | 2020 | 2021 | 2022 | 2023 | 2024 | 2025 |
| In person | 28% | 28% | 24% | 20% | 28% | 28% | 27% | 24% | 29% |
| Online | 57% | 57% | 60% | 69% | 65% | 68% | 69% | 73% | 65% |
| Through the mail | 7% | 7% | 7% | 6% | 5% | 2% | 2% | 2% | 3% |
| Other | 8% | 8% | 9% | 5% | 2% | 1% | 1% | 2% | 3% |
About a fifth (22%) of renters say that their lease allows them to leave with no more than a month of notice. For recent renters, the share is smaller: 14% of those that moved in the past year say their lease allows them to leave with no more than a month of notice.
Among renters on a fixed-term lease, most (59%) said they signed on for a 12-month duration. About one in four (23%) said their lease is longer than a year. Approximately one in eight (12%) said their lease is 2 years or longer, and one in five (18%) say their lease is shorter than 12 months.
Renters were most likely to report moving into their rental in March (10%), April (10%), May (10%) and June (10%). They were least likely to report moving in December (5%) or November (6%).
| Among all renters, share that reported moving in | |
| January | 9% |
| February | 10% |
| March | 11% |
| April | 10% |
| May | 10% |
| June | 10% |
| July | 7% |
| August | 9% |
| September | 7% |
| October | 7% |
| November | 6% |
| December | 5% |
