The Days of Our Lives: How Long Does it Take for Low and High-Income Renters to Find a Home?
On average, renters spend 10.4 weeks on the market searching for a rental home or apartment according to Zillow Group’s 2016 Consumer Housing Trends Report. But renters in tighter rental markets can spend significantly longer searching for a home – and lower-income renters often spend longer still, even in more balanced markets.

Written by Aaron Terrazas on October 25, 2016
- On average, renters spend 10.4 weeks on the market searching for a rental home or apartment.
- Renters in tighter rental markets can spend significantly longer searching for a home, and lower-income renters often spend longer still, even in more balanced markets.
On average, renters spend 10.4 weeks on the market searching for a rental home or apartment according to Zillow Group’s 2016 Consumer Housing Trends Report. But renters in tighter rental markets can spend significantly longer searching for a home – and lower-income renters often spend longer still, even in more balanced markets.
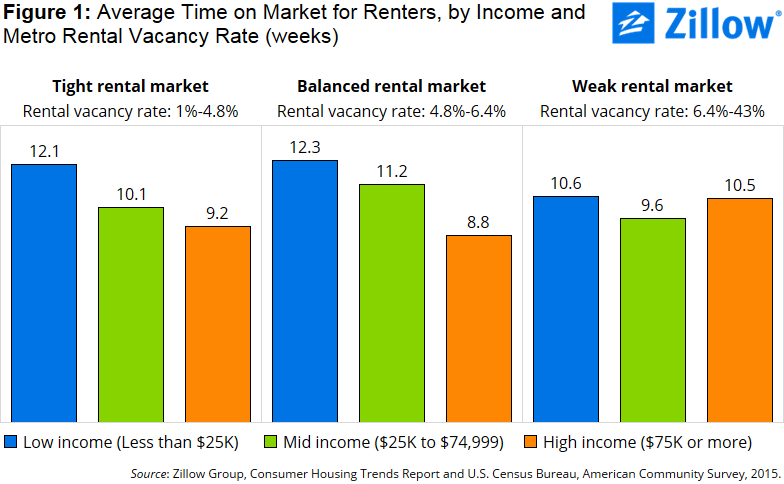
In all but the weakest rental markets, lower-income renters spend three-to-four weeks longer on the market than higher-income renters, according to an analysis of Zillow survey data and vacancy data from the American Community Survey.[1]
We grouped rental markets into three groups: “Tight” rental markets, where the 2015 rental vacancy rate ranged from 1 percent to 4.8 percent; “balanced” rental markets, where the vacancy rate ranged from 4.8 percent to 6.4 percent; and “weak” rental markets where the vacancy rate was greater than 6.4 percent. Similarly, we grouped renter households based on their income: Low-income households, with a combined annual income less than $25,000; middle-income households, with a combined annual income between $25,000 and $75,000; and high-income households, with a combined income of $75,000 or more.
In both tight and balanced rental markets, low-income households spend about three to four weeks longer looking for a home to rent than high-income households, and about one-to-two weeks longer on the market than middle-income households (figure 1). There are no strong patterns across income groups in the weakest rental markets: low- and high-income households spend very similar amounts of time on the market on average.
[1] We looked at individual responses from renters surveyed as part of Zillow’s 2016 Consumer Housing Trends Report about how much time they spent searching for their current rental unit. This data was combined with data on metro-level rental vacancy rates from the U.S. Census Bureau’s 2015 American Community Survey to explore how the search for a rental unit varies across income groups and across different types of rental markets.

Related Articles



Research in your inbox
Get the latest housing data and analysis from Zillow's economists — delivered when the numbers update.

