Sellers: Results from the Zillow Consumer Housing Trends Report 2022
Executive Summary
A global pandemic, historic economic change and an unprecedented shift in the housing market have been hallmarks of the past year. But while these large-scale changes have shifted the landscape and have the potential to reshape sellers’ preferences over the longer term, many behaviors and attitudes remain the same.
The 2022 Consumer Housing Trends Report (CHTR) provides a snapshot of what housing consumers are thinking and doing in mid-2022. In this report, we take a deeper look at sellers (household decision makers who moved in the past year and sold their previous primary residence); In other reports, we examine renters and buyers more closely. Information about who sellers are in 2022 equips business teams with the tools they need to make informed decisions in this transforming housing market landscape.
Who are sellers?
The typical US seller is 46 years old, with about a quarter (27%) age 60 or older. Most are partnered, married or previously married, have at least some college education, and are most likely to sell a home in the South. Demographic change tends to play out over a long time: Most of these characteristics have not changed substantially, if at all, over the last few years. Over two thirds of sellers (71%) also reported buying a home.
What do their homes look like?
Most sellers (75%) sold a single-family detached house — however, other home types like a townhouse/rowhouse (10%) or condo/co-op (7%), while representing a smaller share of transactions, still constitute thousands of sales. The typical seller’s previous home had three bedrooms, 2.5 bathrooms and was between 2,000 and under 3,000 square feet. The average seller reported living in their home for 14 years prior to selling.
Survey Methodology
Research Approach
In order to gain a comprehensive understanding of US sellers, Zillow Group Population Science conducted three nationally representative surveys of more than 5,900 unique sellers. The study was fielded between March and June 2022. Wherever possible, survey questions from previous years were asked in the same manner this year to allow for the measurement of year-to-year trends in key areas of business interest.
For the purpose of this study, “sellers” refers to household decision makers 18 years of age or older who moved and sold their previous primary residence within the past year.
Sampling & Weighting
Results from this survey are nationally representative of recent sellers. To achieve representativeness, ZG Population science used statistical raking to ensure that the distribution of survey respondents matched the US seller population with respect to a number of key demographic characteristics. In order to align estimates with the most recent data on sellers, weighting utilized the US Census Bureau, 2019 American Community Survey and other external benchmarks.
Quality Control
To reduce response bias, survey respondents did not know that Zillow Group was conducting the survey. Several additional quality control measures were also taken to ensure data accuracy:
- We identified and terminated any professional respondents, robots or those taking the survey on multiple devices.
- Completion times were recorded to ensure that surveys submitted by the fastest respondents, who may have rushed through the survey, did not provide poor quality data. If necessary, these respondents were removed from the sample.
- In-survey quality control checks identified illogical or unrealistic responses.
Additional Data Sources
Unless otherwise specified, estimates in this report come from the Consumer Housing Trends Report (CHTR) 2021, and year-over-year comparisons also use data from CHTR 2018, CHTR 2019, CHTR 2020 and CHTR 2021. To provide a fuller picture of the state of home rentals and buyers’ characteristics, preferences and behaviors, we also analyzed data from other sources:
- US Census Bureau, 2019 American Community Survey – The most recently available dataset from the US Census Bureau’s survey of the US population. The ACS is the nation’s largest survey and is based on a probability sample; as such, it is considered one of the leading sources of information on US population and housing.
- US Census Bureau, 2019 American Housing Survey – The most recently available dataset from the US Census Bureau’s housing survey. The AHS includes housing details absent from the ACS, such as whether movers owned their previous home, their reasons for moving, and other detailed housing characteristics.
- U.S. Census Bureau, 2021 Current Population Survey Annual Social and Economic Supplement – The CPS ASEC offers the most recent demographic estimates on the US population.
- Zillow.com website metrics – To provide additional context for survey results, ZG Population Science also examined internal Zillow data on listing information.
The Typical Seller & Home Sold
In this section, we provide a high-level overview of key seller information and what the homes they sold looked like. According to the most recent Census Bureau American Housing Survey (AHS) data available, 4% of households in the country have recently sold. Throughout this section, information about sellers comes from CHTR, and information about other groups comes from ZG Population Science analyses using ACS and AHS data.
Age
The median age of US sellers is 46. About 12% are in their twenties or younger, while roughly a third (30%) are in their sixties or older. In other words, the age distribution of sellers represents somewhat of a middle ground when it comes to US housing consumers: They are typically younger than tenured homeowners (with a median age of 56) who have not moved in the past year, but older than renters (age 33). In regard to age, sellers are more similar to buyers (age 43) than tenured homeowners. These numbers only slightly shifted year-over-year.
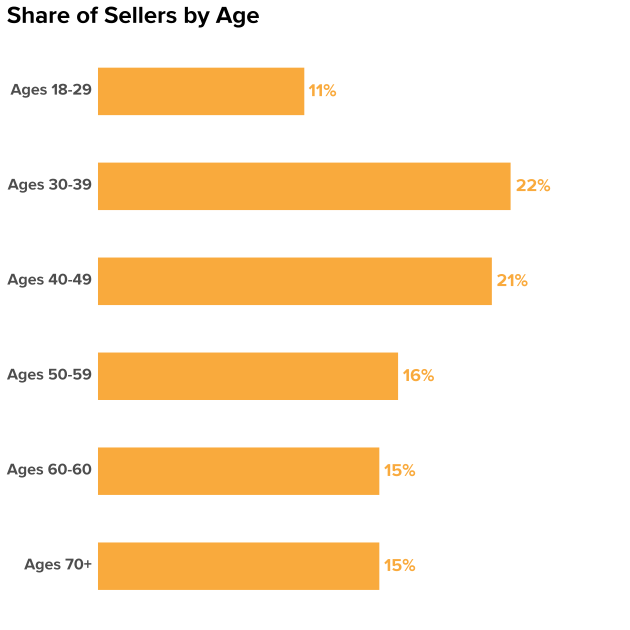

| Age Group | Share of Sellers | Share of Household Decision Makers [1] | Share of US Adults |
| Ages 18-29 | 11% | 12% | 20% |
| Ages 30-39 | 22% | 18% | 17% |
| Ages 40-49 | 21% | 17% | 16% |
| Ages 50-59 | 16% | 18% | 16% |
| Ages 60-69 | 15% | 17% | 15% |
| Ages 70+ | 15% | 17% | 15% |
Source: Census Bureau, 2021 Current Population Survey Annual Social and Economic Supplement
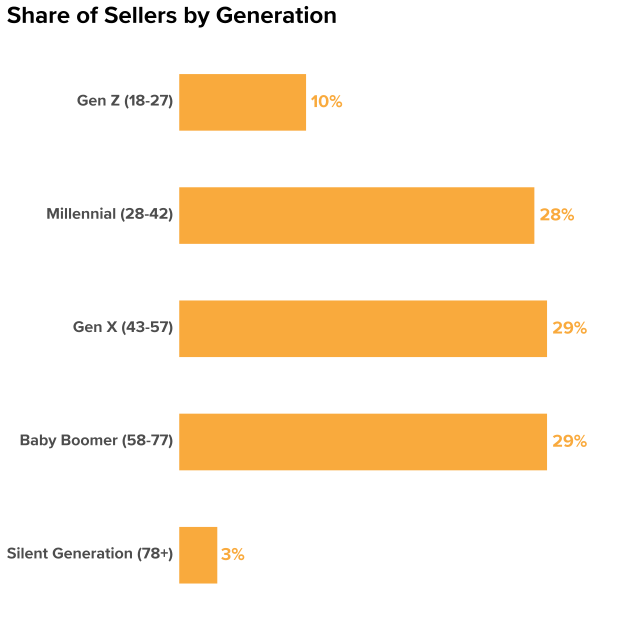
| Generation [2] | Share of Sellers | Share of Household Decision Makers | Share of US Adults |
| Gen Z (18-27) | 10% | 7% | 14% |
| Millennial (28-42) | 28% | 27% | 26% |
| Gen X (43-57) | 29% | 26% | 23% |
| Baby Boomer (58-77) | 29% | 32% | 28% |
| Silent Generation (78+) | 3% | 8% | 7% |
Source: Census Bureau, 2021 Current Population Survey Annual Social and Economic Supplement
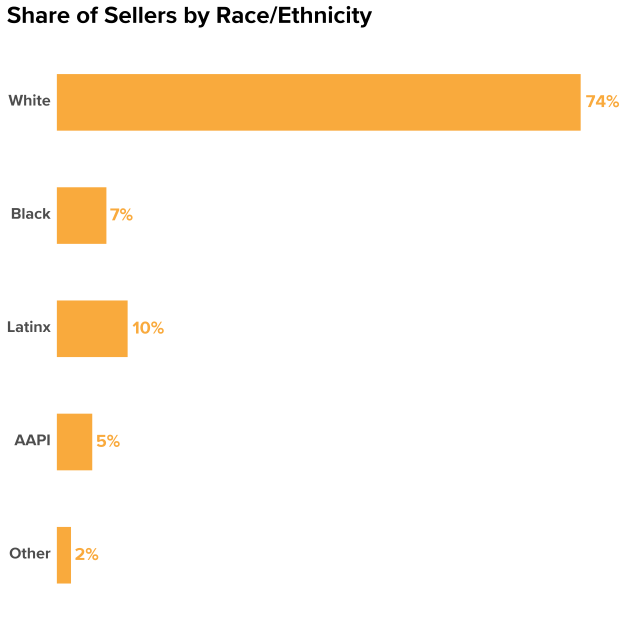
Race & Ethnicity
Almost three quarters of sellers are non-Hispanic white or Caucasian (74%), higher than the overall share of the US adult population that is white (63%).

Region
The largest share of sellers live in the South (39%), followed by the Midwest (23%) and West (22%). The smallest share lives in the Northeast (15%). Sellers largely follow the distribution of US adults, with a slightly higher concentration in the South – which has historically had more home construction and inventory than other regions.
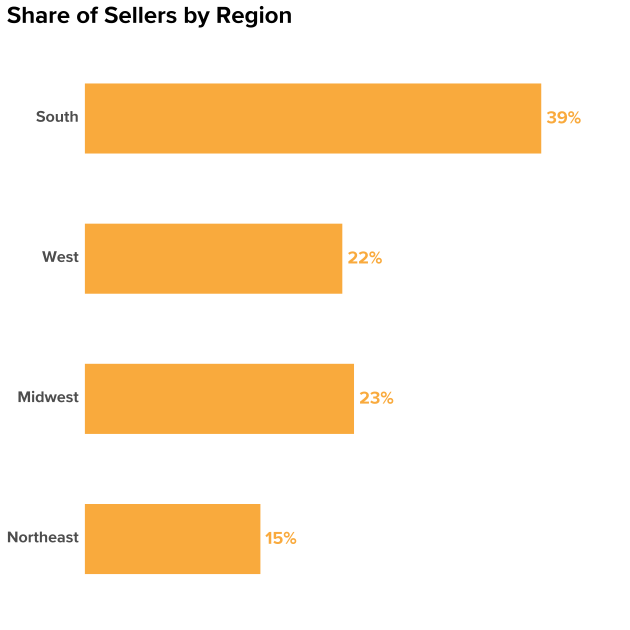
| Region | Share of Sellers | Share of Household Decision Makers | Share of US Adults | Share of For Sale Housing Inventory |
| South | 39% | 38% | 38% | 44% |
| West | 22% | 23% | 24% | 22% |
| Midwest | 23% | 21% | 21% | 19% |
| Northeast | 15% | 17% | 17% | 15% |
Source: Census Bureau, 2021 Current Population Survey Annual Social and Economic Supplement
Note: Share of For Sale Housing Inventory comes from Zillow’s listings data as of June 29th, 2022.
Income
The annual median household income among sellers is approximately $80,000 to $84,999, higher than the overall national median (2021) of $65,700.[3]
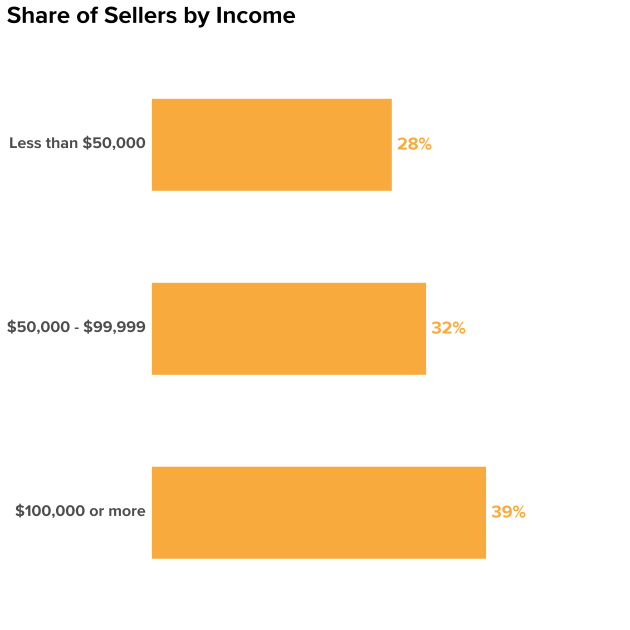
| Income | Share of Sellers | Share of Household Decision Makers | Share of US Households |
| Less than $50,000 | 28% | 39% | 36% |
| $50,000 – $99,999 | 32% | 30% | 28% |
| $100,000 or more | 39% | 31% | 35% |
Education
Sellers tend to be more educated than US household decision makers overall: 45% of sellers have at least a four-year degree, higher than 34% of decision makers.
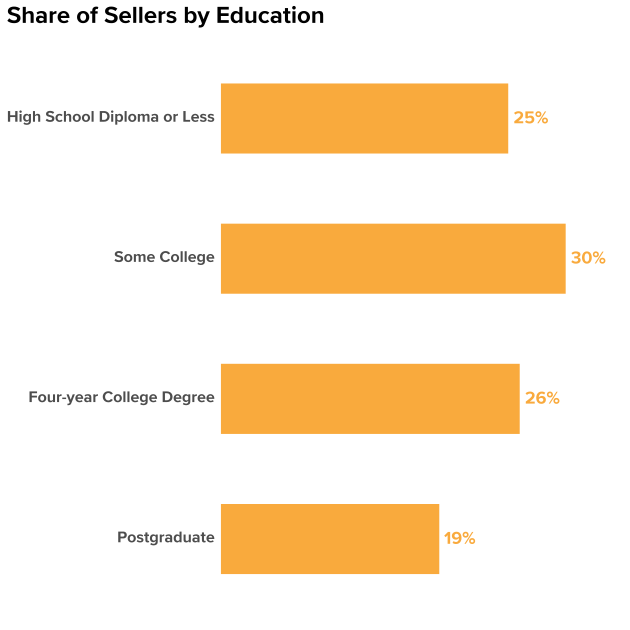
| Education | Share of Sellers | Share of Household Decision Makers | Share of US Adults |
| High School Diploma or Less | 25% | 36% | 39% |
| Some College | 30% | 30% | 30% |
| Four-year College Degree | 26% | 21% | 19% |
| Postgraduate | 19% | 13% | 11% |
Relationship Status
Prior research has shown that the sale and purchase of a home is often tied to family formation or other life events, like a divorce or separation. This relationship between homeownership and family formation helps explain why most sellers are either currently married/partnered (58%) or have been married in the past (25%).
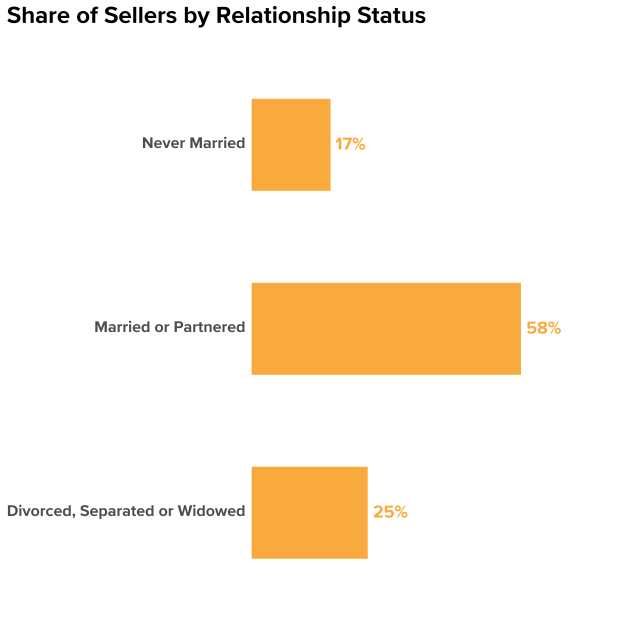

| Relationship Status | Share of Sellers | Share of Household Decision Makers | Share of US Adults |
| Never Married | 17% | 22% | 31% |
| Married or Partnered | 58% | 50% | 50% |
| Divorced, Separated or Widowed | 25% | 28% | 19% |
Home Type, Beds, Baths, and Size
The typical (median) seller sold a 3-bed, 2.5-bath, single-family detached house between 2,000 and 2,999 square feet.
Most Sellers Also Buy
Nearly Three Quarters of Sellers Also Buy A Home
About seven in 10 sellers (71%) reported buying a home in addition to selling one. Almost half of these dual seller-buyers upgraded — buying a more expensive home than the one they sold (44%). This represents a drop from 2021, when 55% of dual seller-buyers purchased a more expensive home.
Seller-Buyers who Upgrade Skew Younger and Higher Income
The typical seller-buyer who upgrades to a more expensive home is 45 years old. The median household income for these upgrading seller-buyers is around $97,500. In contrast, the median age of a seller-buyer who buys a less expensive home is 55 years old and their typical household income is around $67,500.
Despite a Hot & Competitive Market, Most Seller Experiences were Similar to Past Years
Number of Offers
Consistent with the past four years, the typical seller received two offers — but a notable share received many more than that. Almost a quarter (26%) of sellers reported getting at least four offers, continuing the upward trend from 14% in 2020. Since 2019, the share of sellers that report selling without any offers (often sellers who forgo the traditional selling process, often selling to friends or family) fell 11 points from 14% in 2019 to 3% in 2022. [4]
| Number of Offers | 2018 | 2019 | 2020 | 2021 | 2022 |
| 0 | 11% | 14% | 12% | 9% | 3% |
| 1 | 36% | 36% | 37% | 31% | 23% |
| 2 | 23% | 22% | 23% | 20% | 27% |
| 3 | 14% | 12% | 13% | 16% | 22% |
| 4 or more | 15% | 17% | 14% | 24% | 26% |
| Median (typical) | 2 | 2 | 2 | 2 | 2 |
Offers that Fell Through
The share of sellers that reported having an offer fall through remained stable in 2022 as well: The typical seller reported having zero offers fall though.
| Number of Offers that Fell Through | 2018 | 2019 | 2020 | 2021 | 2022 |
| 0 | 59% | 60% | 58% | 56% | 54% |
| 1 | 24% | 21% | 21% | 21% | 23% |
| 2 | 8% | 9% | 10% | 11% | 12% |
| 3 | 4% | 3% | 4% | 6% | 7% |
| 4 or more | 5% | 8% | 7% | 7% | 4% |
| Median (typical) | 0 | 0 | 0 | 0 | 0 |
Cash Offers
Most sellers (62%) said that at least one of the offers they received was all cash or did not include a financing contingency. The fact that more than three quarters (78%) of buyers purchased with a mortgage, though, suggests that buyers who finance with a mortgage can still compete with cash offers — assuming their offer is sufficiently appealing in other ways. Not surprisingly, sellers generally value money and time when selling their home. When asked about their top consideration when selling their home, most have consistently reported maximizing profit as their top priority (55% of sellers considered this their top priority). Second to profit, sellers have been most likely to consider selling within their target timeframe a top priority (35%). Taken together, these pieces of information suggest that a cash offer can still fail if a seller feels that the offer is too low or risks delaying the sale (insufficient earnest money or the offer being contingent on the sale of the buyer’s home, for example).
Inspections
Also reflecting that the market remained a seller’s market, most sellers (57%) said they received at least one offer that waived an inspection. However, 88% of successful buyers said they got an inspection prior to finalizing their home purchase. A similar share of sellers (84%) reported that a potential buyer completed an inspection on the home at least once. The discrepancy between offers that waive inspections and the share of buyers who complete one suggests that waiving inspection contingencies is not a surefire way to win against other offers. Much like competing with cash, buyers who insist on an inspection can still generally win if their offer is adequately appealing to a seller’s desire for profit and undelayed timeline.
| Share of Sellers that Reported | 2018 | 2019 | 2020 | 2021 | 2022 |
| 0 Inspections completed by a potential buyer | 19% | 21% | 19% | 16% | 14% |
| 1-3 Inspections | 73% | 71% | 72% | 73% | 79% |
| 4 or More Inspections | 8% | 8% | 9% | 12% | 7% |
| Median number of inspections | 1 | 1 | 1 | 1 | 1 |
Sellers Continue to Stick with Agents
Rising digital options like remote viewings, 3D tours, and instant offers appear to complement the services that real estate agents offer, not replace them. Sellers’ use of a real estate agent has remained high over the last three years. [5] Indeed, sellers are more likely to use a real estate agent (88%) than other resources to sell their home, such as a website on a computer (64%), mobile website (55%), app (41%), friend/relative/neighbor/colleague (46%), print ad (31%) or direct mail (32%).
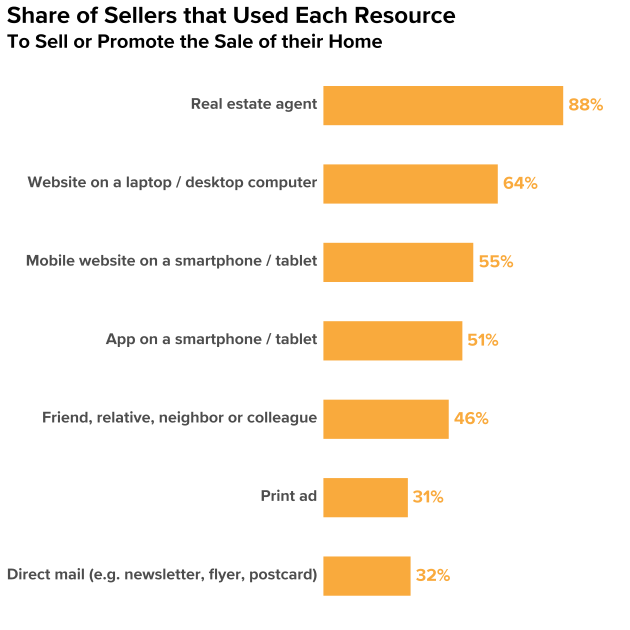
| Share of sellers who used each resource to help sell or promote the sale of their home | 2019 | 2020 | 2021 | 2022 |
| Real estate agent | 83% | 83% | 82% | 88% |
| Website on a laptop / desktop computer | 51% | 54% | 66% | 64% |
| Mobile website on a smartphone / tablet | 40% | 44% | 55% | 55% |
| App on a smartphone / tablet | 37% | 42% | 48% | 51% |
| Friend, relative, neighbor or colleague | 43% | 41% | 42% | 46% |
| Print ad | 32% | 33% | 26% | 31% |
| Direct mail (e.g. newsletter, flyer, postcard) | 25% | 31% | 24% | 32% |
Selling Activities
Rebound in Share of Sellers who Have an Open House
The typical seller still holds only one open house, but the share that forego open houses entirely fell in the past year: 33% said they had none in 2022, compared to 43% in 2021.
| Share of Sellers that Reported Having | 2018 | 2019 | 2020 | 2021 | 2022 |
| 0 Open Houses | 37% | 38% | 39% | 43% | 33% |
| 1-3 Open Houses | 49% | 44% | 45% | 44% | 56% |
| 4 or More Open Houses | 14% | 16% | 16% | 13% | 11% |
| Median number of open houses | 1 | 1 | 1 | 1 | 1 |
Most sellers report leaving their home at least once for a private showing or open house (72%). However, in 2022 sellers were less likely to report doing so four times or more (19% compared to 27% in 2021 and 32% in 2020).
| Share of Sellers that Reported Leaving Their Home for a Private Showing or Open House | 2019 | 2020 | 2021 | 2022 |
| 0 times | 30% | 28% | 32% | 28% |
| 1-3 times | 39% | 40% | 42% | 51% |
| 4 times or more | 31% | 32% | 27% | 19% |
| Median | 2 | 2 | 1 | 1 |
Taking Home Off the Market is Atypical
Two thirds of sellers (69%) never take their home off the market until it is sold.
| Share of Sellers that Reported temporarily taking their home off the market | 2018 | 2019 | 2020 | 2021 | 2022 |
| 0 times | 71% | 71% | 66% | 72% | 69% |
| 1-3 times | 25% | 23% | 26% | 23% | 27% |
| 4 times or more | 4% | 6% | 8% | 5% | 5% |
| Median | 0 | 0 | 0 | 0 | 0 |
Most Sellers Complete At Least One Home Improvement
Most sellers (71%) said they completed at least one improvement project as part of selling their home (e.g. painting, redecorating, kitchen improvement, new appliances, replacing/repairing flooring, etc).
Younger sellers are more likely to report completing at least one home improvement: 84% of sellers in their 20s or younger say they completed at least one, as did 83% of sellers in their 30s, 74% in their 40s, and 69% in their 50s. Closer to half of sellers in their 60s (60%) and 70s or older (51%) say they completed an improvement.
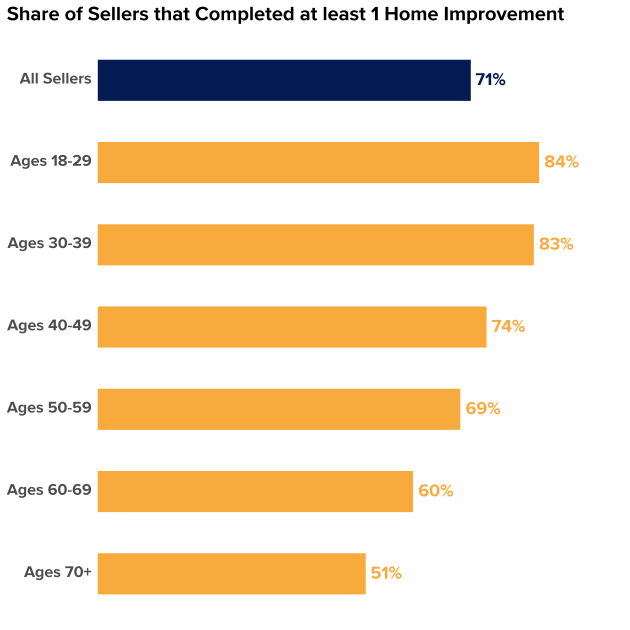
| Share of sellers that | All Sellers | Ages 18-29 | Ages 30-39 | Ages 40-49 | Ages 50-59 | Ages 60-69 | Ages 70+ |
| Completed at least one home improvement | 71% | 84% | 83% | 74% | 69% | 60% | 51% |
The Seller-Agent Relationship
Almost all sellers (92%) indicate some kind of agent use. About 73% said they hired an agent to help promote their home and find potential buyers. And about one in five (18%) say they hired an agent to finalize the sale, but found potential buyers and promoted the home on their own. [7]
How Sellers First Found their Agent
Sellers who worked with an agent were nearly twice as likely to report finding their agent online in 2022 as in 2018 and 2019: about 15%-16% of sellers reported finding their agent online in 2018 and 2019 versus 30% in 2022. Overall, about a fifth (20%) of sellers using an agent reported finding them on a real estate website; 4% reported a search engine, and 6% reported social media. This growth in finding an agent online appears to, in part, be at the expense of finding an agent via a referral. About 31% of sellers said they found their agent via some sort of a referral in 2018, as did 26% in 2022. Past experience with their agent also fell: 23% in 2018 versus 15% in 2022.
| Share of Sellers with an agent that said they first found their agent from each resource | 2018 | 2019 | 2022 |
| Real estate website / app (e.g. Zillow, RE/MAX, Realtor.com) | 9% | 2% | 20% |
| Search engine (e.g. Google, Bing) | 3% | 8% | 4% |
| Social networking website / app (e.g. Facebook, Nextdoor, Twitter, Instagram) | 3% | 6% | 6% |
| Net: Online | 15% | 16% | 30% |
| Past experience with this agent, realtor, or broker | 23% | 21% | 15% |
| Visited an open house and met agent, realtor, or broker | 5% | 7% | 5% |
| Saw contact information on For Sale/Open House sign | 5% | 5% | 3% |
| Referral from other agent, realtor, or broker | 3% | 6% | 5% |
| Referral from friend, relative, neighbor or colleague | 28% | 22% | 18% |
| Referral from home builder | – | – | 3% |
| Net: Referral | 31% | 28% | 26% |
| Newspaper ad | 1% | 3% | 2% |
| Direct mail (e.g. newsletter, flier, postcard) | 2% | 3% | 3% |
| Know them from my community | 13% | 16% | 12% |
| Other | 5% | 1% | 2% |
| Said they first found their agent from each resource | Sellers with an agent | First-Time seller with an agent |
Repeat seller with an agent |
| Real estate website / app (e.g. Zillow, RE/MAX, Realtor.com) | 20% | 24% | 16% |
| Search engine (e.g. Google, Bing) | 4% | 4% | 4% |
| Social networking website / app (e.g. Facebook, Nextdoor, Twitter, Instagram) | 6% | 8% | 4% |
| Net: Online | 30% | 35% | 25% |
| Past experience with this agent, realtor, or broker | 15% | 7% | 23% |
| Visited an open house and met agent, realtor, or broker | 5% | 7% | 4% |
| Saw contact information on For Sale/Open House sign | 3% | 4% | 2% |
| Referral from other agent, realtor, or broker | 5% | 5% | 5% |
| Referral from friend, relative, neighbor or colleague | 18% | 19% | 18% |
| Referral from home builder | 3% | 4% | 3% |
| Net: Referral | 26% | 28% | 25% |
| Newspaper ad | 2% | 2% | 2% |
| Direct mail (e.g. newsletter, flier, postcard) | 3% | 3% | 2% |
| Know them from my community | 12% | 11% | 15% |
| Other | 2% | 2% | 2% |
Zillow leads its online competitors in connecting sellers to agents online – for both first-time sellers and repeat sellers.
Trustworthy, Responsive Among Highly Important Agent Characteristics
While finding an agent via past experience or a referral became slightly less common, most sellers still consider these aspects highly important (59% said past personal experience was highly important, as did 57% about a referral).
Like in previous years, trustworthy (79%) and responsive (75%) first impressions were among the characteristics sellers were most likely to consider highly important in an agent. Similarly high were local and neighborhood-specific knowledge (75%) and a positive reputation in the community (73%).
While not among the top characteristics, sellers surveyed in 2022 saw the largest jump in high importance of a lower commission or rebate – possibly something more sellers were able to negotiate given a low-inventory, high-demand market that favored sellers. In 2018 and 2019, 49% of sellers with an agent considered such a rebate very or extremely important – jumping 10 points to 59% in 2022.
| Share of Sellers with an agent that said each characteristic was very/extremely important in an agent | 2018 | 2019 | 2022 |
| Positive general reputation in the community | 74% | 68% | 72% |
| Was part of a recognizable brokerage (e.g. RE/MAX, Coldwell Banker, Century21) | 57% | 55% | 53% |
| Strong sales history / high number of recent sales | 69% | 66% | 67% |
| Online reviews and ratings of the agent or broker | 49% | 52% | 56% |
| Agent or broker was part of a team | 46% | 50% | 51% |
| Past personal experience with the agent or broker | 55% | 58% | 58% |
| Referral from friend, relative, neighbor or colleague | 52% | 52% | 56% |
| Initial impression of agent or broker: responsive | 81% | 76% | 74% |
| Initial impression of agent or broker: trustworthy | 86% | 77% | 78% |
| Had local market and/or neighborhood-specific knowledge | 80% | 74% | 74% |
| Charged a lower commission or offered a rebate | 49% | 49% | 57% |
Sellers Value Floor Plans, Virtual Tours in their Listings
Sellers Largely Consider Floor Plans and Virtual Tours as Highly Important Listing Characteristics
Most sellers say that including a virtual tour in their home listing is very or extremely important (60%) – compared to only 17% who said it was not very or not at all important. An even larger share (76%) said that including a floor plan in their home listing was a highly important listing characteristic.
Sellers with Floor Plans, Virtual Tours Typically Sell for More, More Likely to Attract a Cash Offer
Sellers who included a virtual tour in their home listing were more likely to report receiving at least 1 all cash offer (70%) than sellers who did not include a virtual tour (56%), and they typically sold for 22% more.
The presence of a virtual tour or floor plan alone does not explain these differences, though. Sellers who include virtual tours and/or floor plans in their listings tend to be younger, higher income, and more likely to sell in regions with especially hot markets. The median age of a seller who included a floor plan in their listing, for example, was 45 years old – 11 years younger than the typical seller who did not include one (56 years old). And the typical household income of a seller with a home that included a virtual tour or a floor plan ($95,000 to $99,999) was higher than sellers of homes without one ($65,000 to $69,999). While 59% of sellers nationwide reported including a floor plan in their listing, 64% of those in the West and 67% in the Northeast said they included one – higher than 56% of Southern and Midwestern sellers. By extension, homes that included a floor plan or virtual tour likely systematically differ from homes that did not.
Sellers Prefer Agents who Include Interactive Floor Plans, Virtual Tours in their Services
Most sellers say they are more likely to hire an agent who includes virtual tours and/or interactive floor plans in their services (70%). First-time sellers were especially likely to say so: 75% said they were more likely to hire such an agent, compared to 70% of sellers who sold one home previously and 63% of those who had sold multiple.
[1] Zillow Group Population Science calculates estimates for “Household Decision Makers” when utilizing CPS data by averaging the characteristics of heads of household and their spouses and/or partners within a household. For renter households, this definition also includes roommates/housemates.
[2] Zillow Group Population Science defines Gen Z as those born between 1995 and 2003, Millennials between 1980 and 1994, Gen X between 1965 and 1979, Baby Boomers between 1945 and 1964, and Silent Generation in 1944 and earlier.
[3] National median income is from US Census Bureau, 2019 American Community Survey.
[4] This change may partly be due to measurement change. Starting in 2022, the question moved to multiple choice from text entry in order to reduce respondent burden (especially for sellers who respond via mobile phone) and improve data quality. Additionally, higher sale prices may have encouraged more people to sell via the traditional process rather than through friends or family.
[5] CHTR began asking this question in its current format three years ago, in 2019.
[6] Prior to 2021, CHTR was collected by an external vendor. Methodological improvements that accompanied a shift to in-house data collection likely overstate the magnitude of year-to-year change for many resources, especially website, mobile and app usage.
[7] About 1% of sellers said they used an agent but never hired one; this group likely used an unpaid agent they knew personally.