Sisters Making it by Ourselves: A Recent History of Labor Force Participation, Attaining Homeownership, and the Current Ability of Women to Own it Alone.

One of the key features of homeownership is control. Compared to a renter, the owner can do as they please to the property. More than that, access to home equity funds or a refinance to lower the mortgage payment during a crisis is stabilizing. Access to home equity over the long run can translate into a self-determined retirement. The power of homeownership, the primary wealth building mechanism of Americans, is why we report on homeownership rates so often. Inspired by Women’s History Month, and that long history of progress toward self-determination and personal agency within our workplaces and our families, we turn to the no-longer narrowing gap between women and men’s homeownership rates and the ability of single women to afford the listings that are on the market today.
Now for the most part, women and men become homeowners after partnering for the long haul, after getting married. But once within the household unit, the reasonability of assigning the ownership of the home to one or the other partner is unclear. We focus instead on the homeownership of young single women and single men.
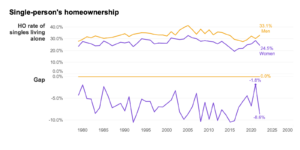
Despite women in general showing remarkable resilience in returning to the workforce since the beginning of the pandemic, single women’s homeownership rate took a heavy hit in 2022. Single men historically have had higher ownership rates than women, but from 2015 to 2021 the gap was aggressively narrowing to a mere 1.8 percentage points by 2021. That progress was wiped out in 2022.
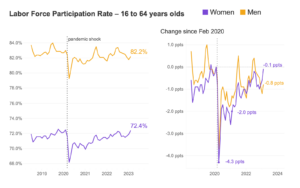
The first year of the pandemic had a greater impact on women’s labor force participation (LFP). More likely to take on caregiving responsibilities and as child- and eldercare options were in flux, women’s labor force participation rate was over 2 percentage points down on average over 2020 and early 2021, compared to a 1.3 percentage point drop for men over the same period. Prior to the pandemic, women’s labor force participation was growing quickly out of the Global Financial Crisis, leading to record-high numbers of women in the workforce in late 2019 (72.6% LFP in October) and rising women’s incomes.
By the end of 2021, the extra impact from the pandemic on women’s LFP rate had disappeared. Today, women’s LFP rate is pretty much back to its pre-pandemic level: 72.4% of working age women in the workforce. Men’s LFP rate remains 0.8 percentage points below pre-pandemic levels (February 2020 to February 2023).
Until 2022, the rising women’s LFP rate, an indicator of economic health and activity among women, coincided with a rise in single women’s homeownership rates. After growing to 28.6% by 2021, single women’s homeownership experienced a 4.1 percentage point drop in 2022 to 24.5%, wiping out almost half the remarkable gains since 2016 when single women’s homeownership was at an all time low of 19.4%. This is particularly troubling when compared to the homeownership rate of single men, which increased 2.7 percentage points in 2022 to 33.1%.
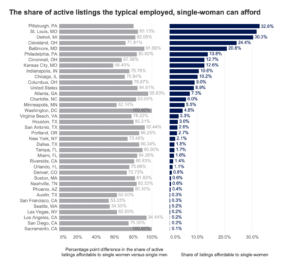
Affordable homeownership remains a challenge for women, who generally earn less than men on average, receiving around 82 cents per dollar. As a result, single women have fewer options when it comes to affordable home listings than single men. Using the median household income of single women ages 18 to 65, we found that the typical, employed single woman could afford only 8.9% of active listings nationally, 84.5% that of men. (The median income of employed single women is $22,000, 88% the median income of single men, in the 2022 CPS sample used; the difference between the “cents-on-the-dollar” estimate and share of homes affordable is then determined by the price distribution of available listings between men and women’s incomes.)
Women who want to make the leap to homeownership will find Pittsburgh, St. Louis, and Detroit have the highest percentage of affordable listings, among the 50 largest metros in the country, but those aren’t necessarily where the earning power is balanced.
Metros where single women and men have the most balanced affordability over available listings include Atlanta, Baltimore, Washington, DC, and Raleigh – all metros where single women can afford at least 2% of all active listings and at least 90% of the listings single-men can afford).
On the other hand, Cincinnati, Kansas City, Oklahoma City, Minneapolis, Jacksonville, and New Orleans see the largest gender-based disparities in housing affordability, with single women affording less than 70% that of single-men.
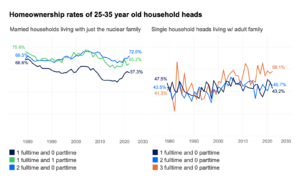
With the current rise in mortgage rates and increasing affordability challenges, it has become difficult for anyone, little alone any one individual to afford a home by themselves. The homeownership rate of newer generations of young adults is famously delayed, significantly lower at 25-35 years old now than in the 1980s. But homeownership rates of the same age group, among dual earning households or single employed adults, homeownership rates in 2022 are level or higher than 1980. It’s single-earning households that have been unable to maintain homeownership at younger ages.
For women to access that greater control that comes with being your own landlord, it may be worth considering the option of doubling up or other creative solutions. Because by the homeownership rate record board, 2022 was a hard year for single women.
Sources and Methodology
Labor force participation rates for working age adults (ages 16 to 64 years) are produced by the Bureau of Labor Statistics and pulled from the FRED API. Annual homeownership rates of households headed by 25 and 35 year olds (annually from 1980 to 2022) and broken out by employment, marital status and living arrangement were estimated by Zillow Economics Research using individual records from the Current Population Survey provided by IPUMS CPS, the University of Minnesota, www.ipums.org.
The number and share of active listings affordable on Zillow to single women and single men (limited here to employed singles between 18 and 44) were estimated using all listings ever-active on Zillow during February 2023 and median individual incomes by gender, estimated by Zillow Research using individual responses to the American Community Survey also provided in IPUMS at the University of Minnesota. A home is considered “affordable” in this case if the estimated mortgage payment on the listing takes up no more than 30% of income. We set the mortgage rate for this analysis at the average weekly mortgage rate, reported by Freddie Mac, over February.
