- Just over half (53.4 percent) of all workers in Seattle’s South Lake Union Tech Corridor live outside the city of Seattle.
- Among South Lake Union Tech Corridor workers living within Seattle city limits, the majority are concentrated in the Belltown (5.3 percent), Queen Anne (4.4 percent), and Capitol Hill (2.5 percent) neighborhoods.
- Seattle rents have been rising overall, but have increased more in the parts of King County where South Lake Union Tech Corridor workers tend to live. However, many factors beyond employment growth in South Lake Union have contributed to rising Seattle rents.
Seattle’s South Lake Union neighborhood has become synonymous with the city’s rapidly evolving economic and social landscape. The neighborhood has attracted major employers, and cranes crowd the skyline of the former industrial district wedged between the city’s downtown and iconic Space Needle.
Employment growth in the area, driven particularly by the tech sector, has attracted new investment, new jobs, new prosperity and new problems, generating new social tensions and anxieties as the city’s infrastructure struggles to keep pace.
Few issues surrounding Seattle’s recent growth have generated as much attention, or as much passion, as rising rents and deteriorating rent affordability. The median monthly apartment rent in the city of Seattle has increased by 35 percent (roughly $500) since 2011, and surpassed $2,000 for the first time ever in February.[1]
For many Seattleites struggling to keep pace with rising rents, rapid growth in the city’s booming tech sector is an easy scapegoat – an attitude shared by residents in other large tech boomtowns nationwide. There are many interconnected reasons why Seattle rents have been rising, certainly including the strength of the local labor market, but also:
- The difficulty and relatively high costs associated with building new homes and apartments in the city.
- Shifting population preferences for where and how to live.
- The relative affordability of the city when compared to other major tech centers in California and the Northeast.
- The higher rents (and often greater amenities) of newer apartment buildings.
By combining Zillow data on rents with U.S. Census Bureau data on where people live and work, we are able to provide some data-driven context for the emotionally charged debate about the South Lake Union tech boom specifically and rising rents across Seattle and King County in general. We developed this research in collaboration with Seattle Times Columnist Gene Balk, who recently wrote on these trends.
Areas of Concentration
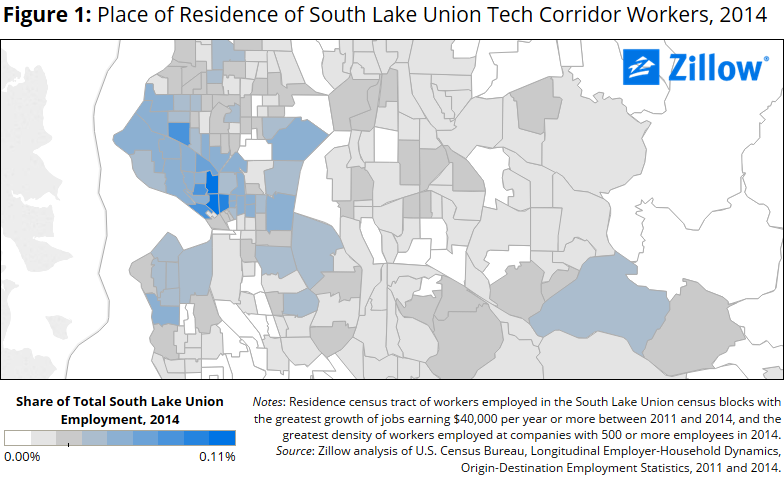
People working in the fastest-growing parts of the South Lake Union Tech Corridor live all across the Seattle area (figure 1).[2] We defined this corridor as the cluster of South Lake Union census blocks that have experienced strong growth in the number of workers earning $40,000 per year or more and that also have high proportions of workers employed by companies with 500 or more employees.[3]
While the South Lake Union tech boom is typically viewed as an urban phenomenon, felt most acutely within the city of Seattle, more than half of these workers (53.4 percent) live outside of the city of Seattle in nearby communities. Mercer Island – a convenient residential island located midway between the city of Seattle and suburban cities east of Lake Washington – is home to a substantial cluster (1.4 percent) of these workers. There are similarly sized clusters in the eastside cities of Kirkland, Redmond, Bellevue and Issaquah.
Within the city, popular neighborhoods for South Lake Union Tech Corridor workers include adjacent areas that are adjacent to South Lake Union:
- Belltown (5.3 percent), Queen Anne (4.4 percent) and Magnolia (2.2 percent) to the north and west of South Lake Union;
- Capitol Hill (2.5 percent), First Hill (1.4 percent) and Eastlake (1 percent) to the east of South Lake Union; and
- Ballard (2.1 percent), Wallingford (1.5 percent) and Fremont (1.1 percent) to the north of South Lake Union.
Farther afield, but still within city limits, 2.3 percent of these workers live in the neighborhoods of Laurelhurst, Montlake, Madison Park, Madrona and Leschi. Another 5.3 percent live in sprawling West Seattle.
 Young and Old
Younger South Lake Union workers – those under age 30 – who are employed in these booming census blocks are more likely than their older colleagues to live close to work (figure 2). Younger workers are more densely concentrated in neighborhoods near South Lake Union (including South Lake Union itself, Belltown, Queen Anne, Capitol Hill, Ballard, Fremont and Wallingford). More than a quarter (27 percent) of these younger South Lake Union Tech Corridor workers live within three miles of their workplace, compared to 22 percent of their colleagues age 30 and up.[4]
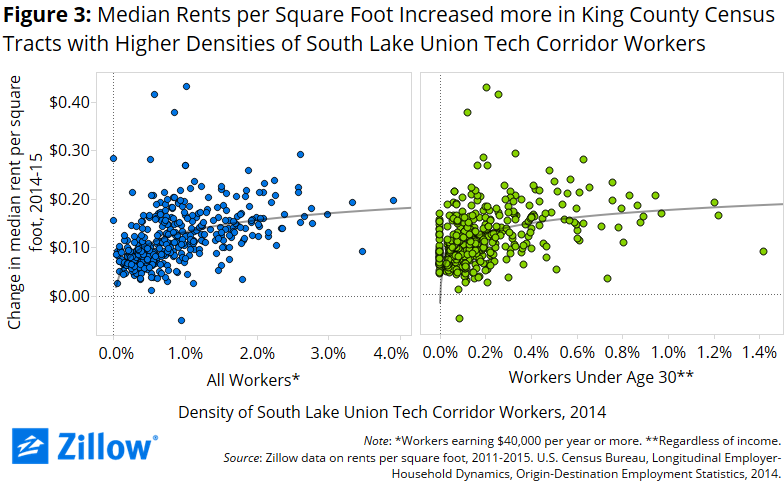
Rents have been rising across the Seattle area, but have increased more in the parts of King County where South Lake Union Tech Corridor workers tend to live (figure 2). The relationship between the share of adults in a census tract who worked in the South Lake Union Tech Corridor as of 2014 and the increase in median rent per-square-foot between 2014 and 2015 is not perfect, but is statistically significant.
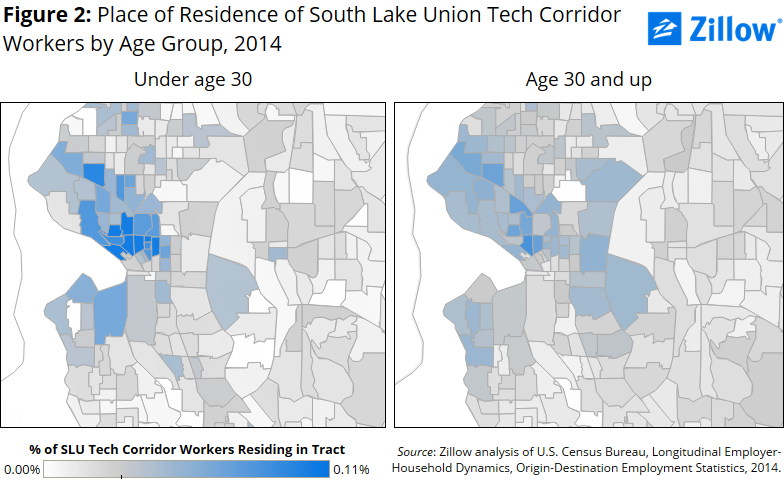 For all South Lake Union Tech Corridor workers, the density across King County census tracts ranges from 0 percent (no South Lake Union Tech Corridor workers live there) to 3.9 percent (about one in every 26 employed adults who live in a tract work in the South Lake Union Tech Corridor). For South Lake Union Tech Corridor workers under age 30, the density across King County census tracts ranges from 0 percent to 1.4 percent. Put another way: In the parts of King County that are most densely inhabited by these young South Lake Union Tech Corridor workers, almost 1 in every 70 employed adults of any age is a young adult working in the South Lake Union Tech Corridor.
Low Base, High Growth
But there are lots of factors driving the booming Seattle rental market beyond growth in South Lake Union (figure 3).
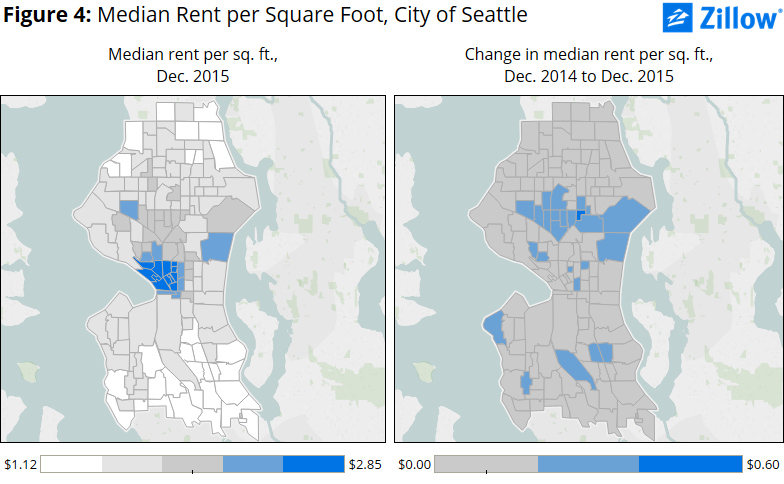
Several areas of Seattle’s University District, and in the upscale enclaves of Medina, Hunts Point, Yarrow Point and Clyde Hill east of Seattle across Lake Washington, have relatively low shares of South Lake Union Tech Corridor workers but relatively large increases in rent per-square-foot. The neighborhood of South Lake Union itself has seen relatively modest rent increases, in part because so many apartments in the area are relatively new and had higher rents to start with. And despite a relatively high density of South Lake Union workers, rents have increased only modestly in the First Hill neighborhood adjacent to downtown, a dense cluster of high rises surrounding several major hospitals. Rents per-square-foot in the city’s International District (Chinatown and Little Saigon) appear to have edged down modestly.
 In general, rents have increased more north of Lake Union and the Lake Washington Ship Canal that roughly bisects the city into two northern and southern halves. Rents have risen more quickly in the northern neighborhoods of Ballard, Fremont, Wallingford, Woodland, Phinney Ridge and the University District than in the historically denser neighborhoods to the east of South Lake Union, in part because they started from a lower base (figure 4). To some degree, there has been a convergence in rents per-square-foot between the neighborhoods directly to the north of South Lake Union and the neighborhoods directly to the east of South Lake Union, although the eastern neighborhoods remain more expensive. Rents have long been very high in the neighborhoods of Queen Anne and Belltown directly to the west of South Lake Union.
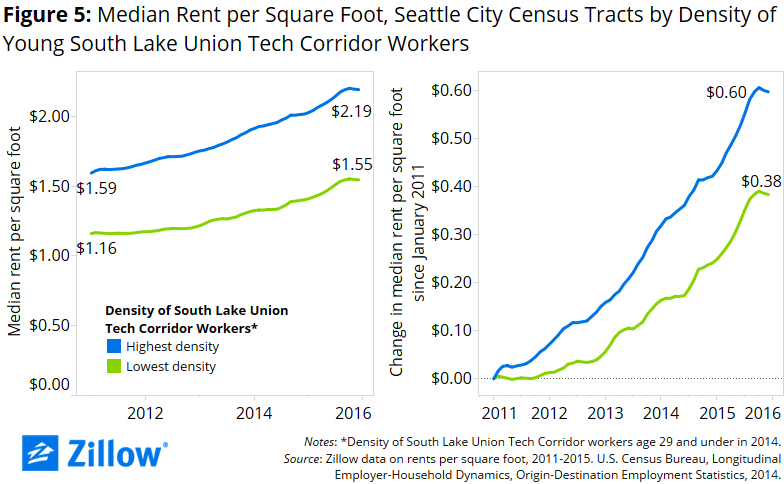
 With these caveats in mind, median rents in the parts of Seattle with highest densities of South Lake Union Tech Corridor workers have diverged from the parts of Seattle with the lowest densities of South Lake Union Tech Corridor workers. In the top fifth of Seattle city census tracts (ranked by the density of South Lake Union Tech Corridor workers under age 30 in 2014), median rents per square foot increased $0.60 between January 2011 and December 2015; in the bottom fifth of census tracts, median rents per square foot increased $0.38 over the same period (figure 5, right). Of course, median rent per square foot was higher to start with in the neighborhoods that became home to the highest densities of young South Lake Union Tech Corridor workers (figure 5, left).
 South Lake Union is hardly the only growing tech corridor in Seattle (Zillow is based in Downtown Seattle). The technology industry – alongside other highly skilled and comparatively highly paid industries such as healthcare and advanced manufacturing – has been expanding in other neighborhoods too, notably in Pioneer Square, Fremont and Capitol Hill. But for many, South Lake Union has become emblematic of the broader economic forces shaping Seattle.
These data show that rents have increased more in the King County neighborhoods where South Lake Union Tech Corridor workers tend to live. Rising demand has contributed to rising prices, and new supply has struggled to keep up. But the association between job growth in South Lake Union and rising rents across the city is not necessarily as tight as might be expected; there are many other factors driving Seattle area rents as well.
Methodology
We use the U.S. Census Bureau’s Longitudinal Employer-Household Dynamics Origin-Destination Employment Statistics (LODES) dataset to identify the parts of the South Lake Union neighborhood that have experienced the largest employment growth in recent years.[5]
First, we compare blocks with the two census tracts that cover South Lake Union – roughly the area bordered by Roy Street on the north, Interstate 5 on the east, Olive Way on the southeast, 3rd Avenue on the southwest, and SR-99 on the northwest – based on two criteria:
- Growth from 2011-to-2014 in the number of people earning more than $40,000 per year who work in the census block, and;
- The share of workers in a census block who worked for a company with 500 or more employees in 2014.
Census blocks that ranked in the top tier for both of these measures are classified as the “South Lake Union Tech Corridor”.
For median rents, we compute a median Zillow Rent Index (ZRI) per-square-foot for each census tract based on Zillow property-level data and Zillow estimates of the rental value of residential properties, regardless of their current tenure. The data are seasonally adjusted using a seasonal trend decomposition based on Loess smoothing and a 3-quarter trailing moving average.
[1] Zillow Rent Index for multifamily units in the city of Seattle.
[2] The map shows census tracts, which are small, relatively permanent statistical subdivisions of counties established by the U.S. Census Bureau.
[3] These 23 census blocks – out of a total 167 blocks in the two census tracts covering South Lake Union – had a total of 11,100 workers in 2014 according to the Census Bureau’s Longitudinal Employer-Household Dynamics, Origin-Destination Employment Statistics, up from 7,100 in 2009 and from 4,600 in 2002.
[4] Euclidian distance from centroid of census tract.
[5] The LODES data are based on Unemployment Insurance records aggregated by the U.S. Census Bureau. They do not necessarily capture some types of nonstandard employment, such as independent contractors or multisite workers. In addition, data are anonymized to prevent the identification of specific employers and individuals. Despite these limitations, it remains that best publicly-available data source to identify where individuals work and live for very detailed geographic levels.

