Suburban Homes Still Feel Recession’s Pinch
Per-square-foot values for both urban and rural homes ($231 and $102 per square foot, respectively) have exceeded their pre-recession highs and are currently at new peaks, but the current value for suburban homes stands below its prior peak of $140, last reached in October 2006.
- U.S. homes in urban ZIP codes have a median value of $315,988, up 8.8 percent from a year ago, compared to $234,443 in the suburbs (up 6 percent year-over-year) and $157,451 in rural areas (up 5.5 percent from December 2016).
- Per-square-foot values for both urban and rural homes ($231 and $102 per square foot, respectively) have exceeded their pre-recession highs and are currently at new peaks, but the current value for suburban homes stands below its prior peak of $140, last reached in October 2006.
- The gap in per-square-foot values between urban and rural homes is currently as wide as it has ever been, surpassing the gulf that existed a decade ago on the eve of the Great Recession.
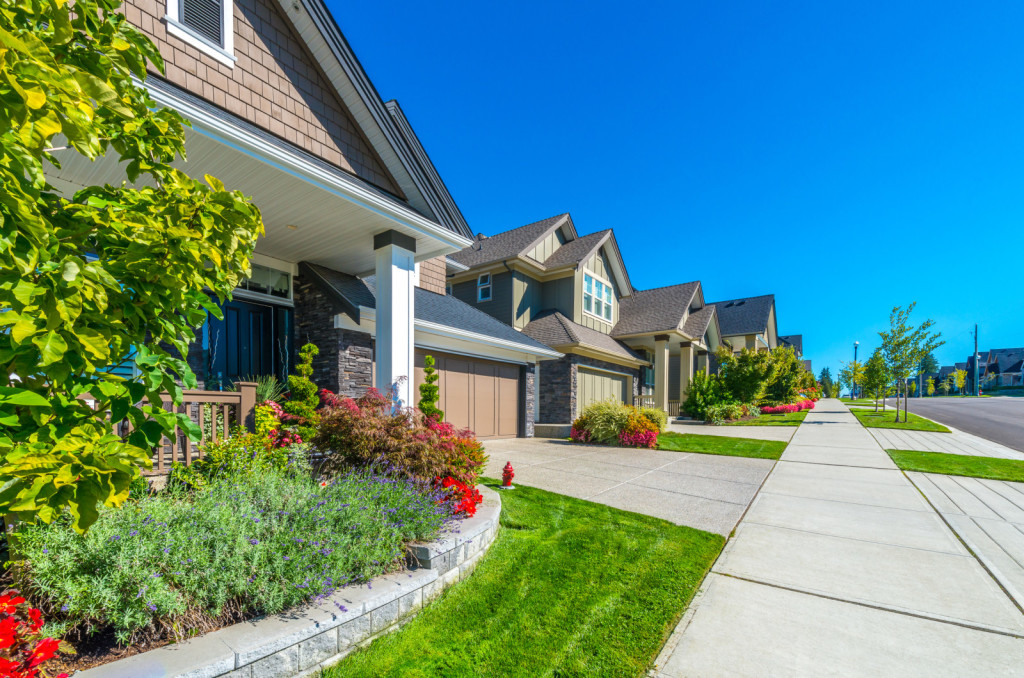
Median U.S. home values continue to reach new highs, putting the dark days of the housing recession farther in the rear view mirror each month. But one perhaps surprising segment of the market still lags: On a per-square-foot basis, suburban homes remain less valuable today than they were a decade ago.
As of December 2017, the median U.S. suburban home was worth $138 per square foot, according to a Zillow analysis of home values and rents in urban, suburban and rural locales.[1] While per-square-foot values for both urban and rural homes ($231 and $102 per square foot, respectively) have exceeded their pre-recession highs and are currently at new peaks, the current value for suburban homes stands below its prior peak of $140, from October 2006.
The data provide another illustration of the deep and lasting scars of the recession, as well as how different market segments have fared in the years since then. Many cities have experienced tremendous growth in recent years as high-paying jobs in tech, healthcare, finance and other booming industries increasingly located in dense urban cores, while other areas have not bounced back.
While both are at new highs, the gap in per-square-foot values between urban and rural homes is currently as wide as it has ever been, surpassing the gulf that existed a decade ago on the eve of the Great Recession. The 127.1 percent difference represents the widest gap since at least January 1996, and exceeds the 124.1 percent gap last experienced in October 2006, months before the housing market peaked prior to the housing bust.
Homes in urban settings have a median value of $315,988, up 8.8 percent from a year ago, compared to $234,443 in the suburbs (up 6 percent year-over-year) and $157,451 in rural areas (up 5.5 percent from December 2016). In the mid-1990s, homes in the suburbs were more valuable overall than urban and rural homes; urban home values surpassed suburban figures in 1998. On a per-square-foot basis, urban homes have always been more valuable than suburban or rural homes.
Renting is also more expensive in the city than in outlying areas. Nationwide, median rent in urban centers was $1,859 per month, compared to $1,583 in the suburbs and $1,189 in rural areas. Unlike home values, suburban rents are growing more quickly than those in the city, rising at a 2.7 percent annual pace, compared to 2 percent in urban locales and 0.9 percent in rural America.
Growth in urban rents consistently outpaced suburban and rural growth beginning in the August 2012 and continuing through 2016. But the annual pace of rent growth in the suburbs started to outpace growth in cities in February 2017, and has continued every month since.
Use the tool below to see rents and home values in your market’s urban, suburban and rural areas, how they have changed over time and how they compare to other markets.
[1] Using data from a series of Zillow Group consumer surveys conducted in 2016 and 2017 that asked respondents to categorize their ZIP code as urban, suburban or rural, Zillow built a model to classify ZIP codes into those three categories. We then used those classifications to analyze home values and rents in all three environments over time. Initial consumer classifications were validated with additional data including population density and measures of walkability.
