Swings and Misses: Home Values in Presidential Swing Counties Fell More, and Have More to Recover
Swing counties – counties won by both Democratic and Republican presidential candidates during the past three presidential election cycles – have, on average, experienced a weaker housing market recovery than counties solidly in the Democratic or Republican columns.
- The housing bust was more dramatic in Democratic and Swing counties than in Republican counties.
- The housing market recovery since 2012 has been most robust in Democratic-leaning counties and has been weakest in swing counties.
Swing counties – counties won by both Democratic and Republican presidential candidates during the past three presidential election cycles – have, on average, experienced a weaker housing market recovery than counties solidly in the Democratic or Republican columns.
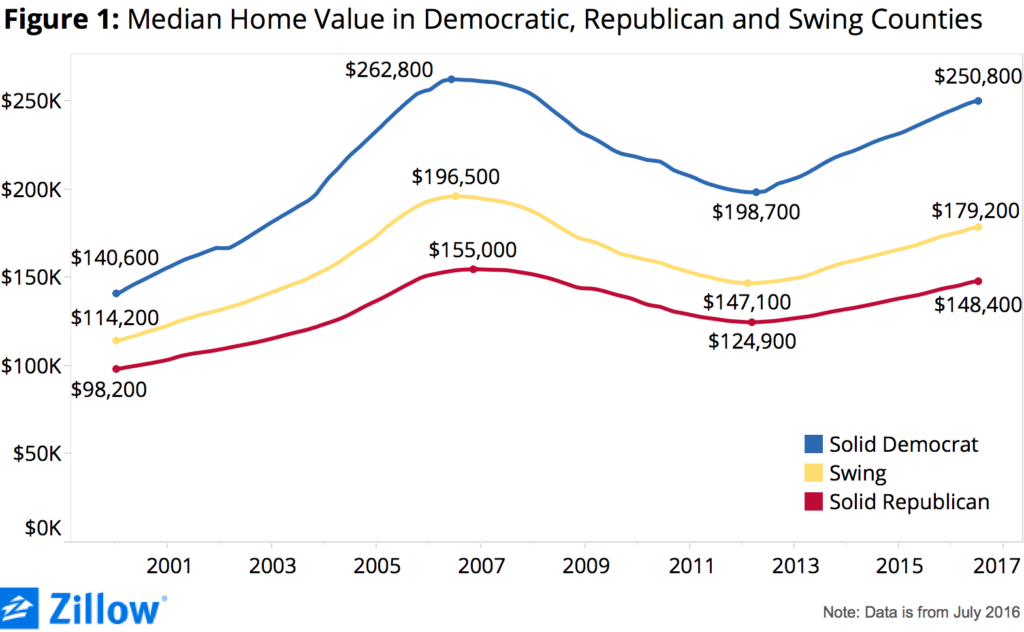
On average, home values tend to be highest in solidly Democratic counties (figure 1). As of July, the median home value in counties won by the Democratic presidential candidate in the past three elections was $250,800, compared to a median home value of $148,400 in counties won by the Republican candidate in the past three presidential elections. In swing counties, the median home value was $179,200.
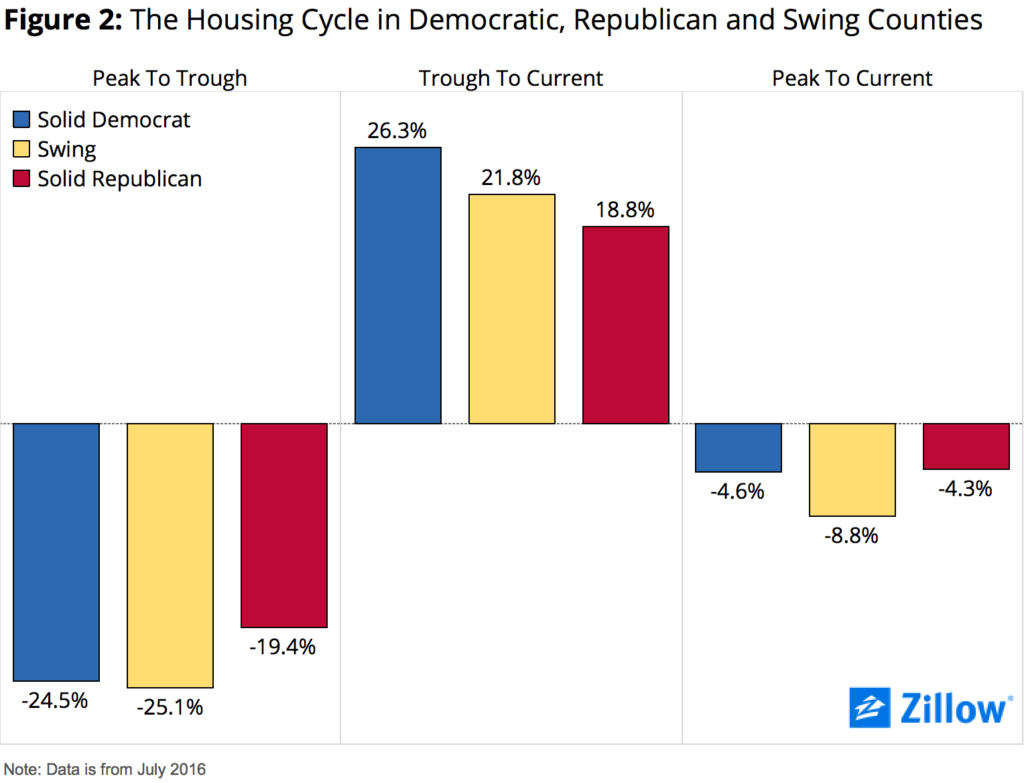
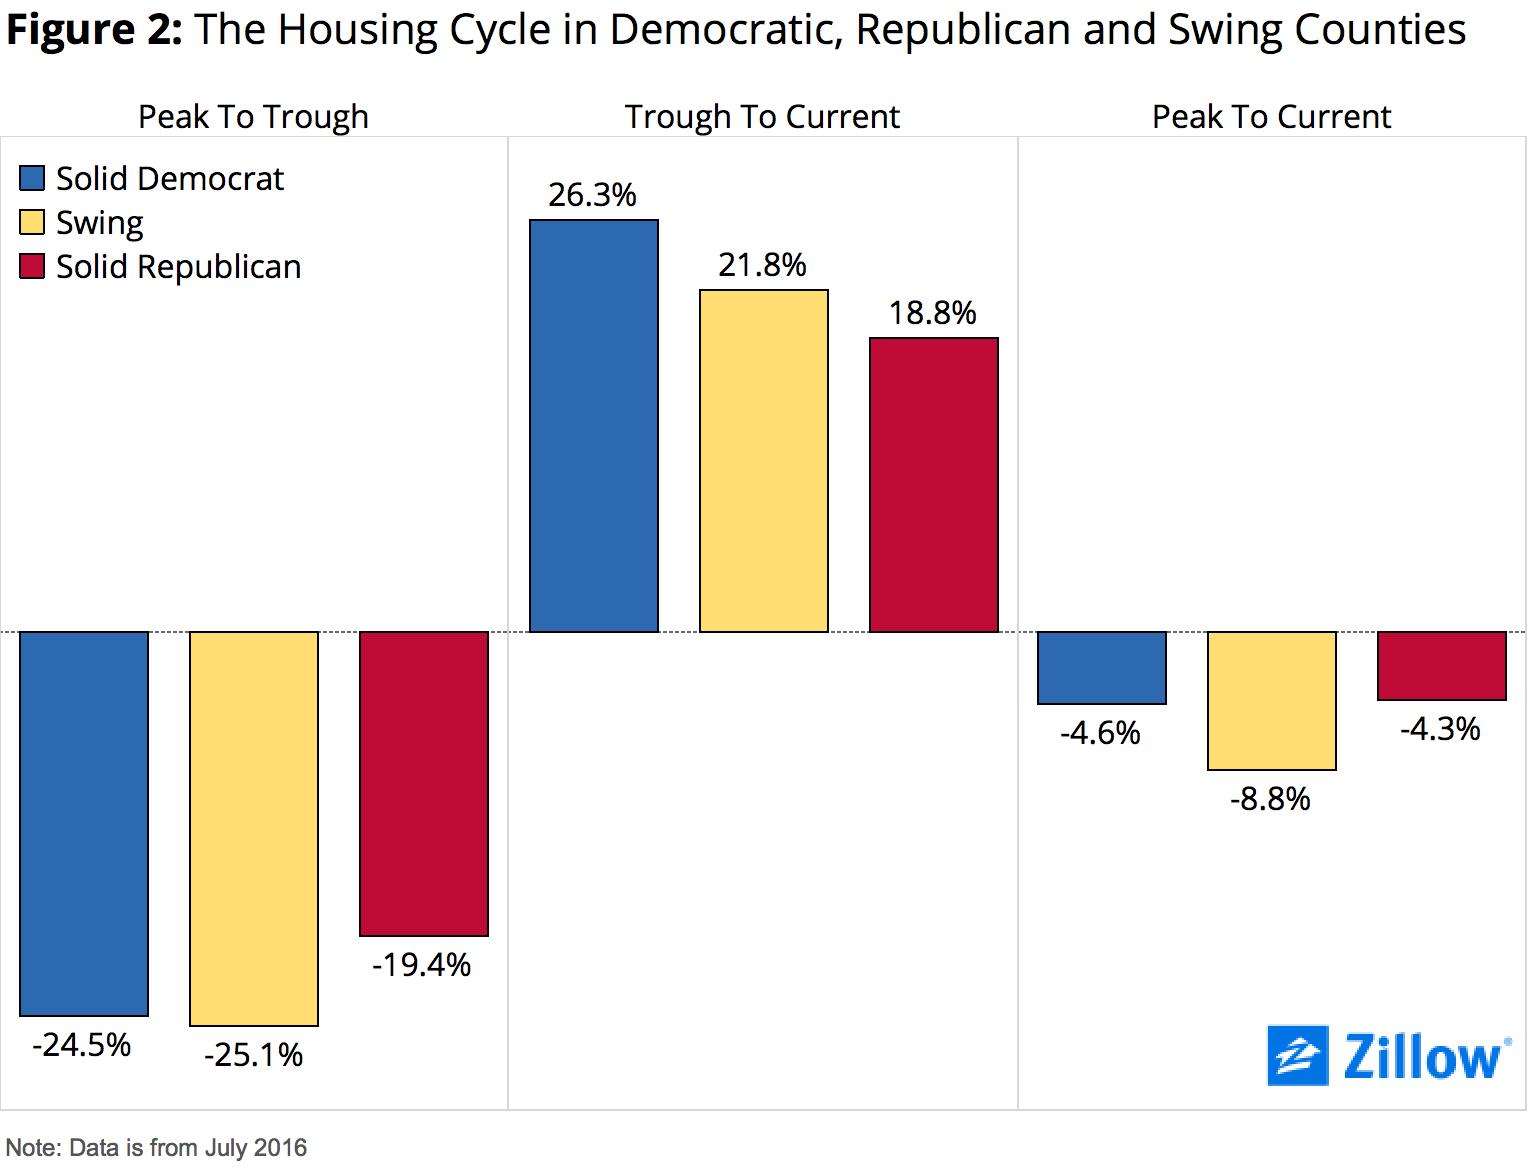
 The housing market bust was more exaggerated in solidly Democratic counties. From pre-crisis peak to the bottom of the market, the median home value in solidly Democratic counties fell 24.5 percent, compared to 19.4 percent in solidly Republican counties. But the decline was even worse in swing counties, falling 25.1 percent from pre-crisis peak to trough.
The housing recovery has been strongest in Democratic-leaning counties. From the bottom of the housing market through July, home values in solidly Democratic counties have increased 26.3 percent and are now 4.6 percent below their pre-crisis peak. In solidly Republican counties, home values have increased 18.8 percent and are now 4.3 percent below their pre-crisis peak. In swing counties, home values remain 8.8 percent below their pre-crisis peak (figure 2).
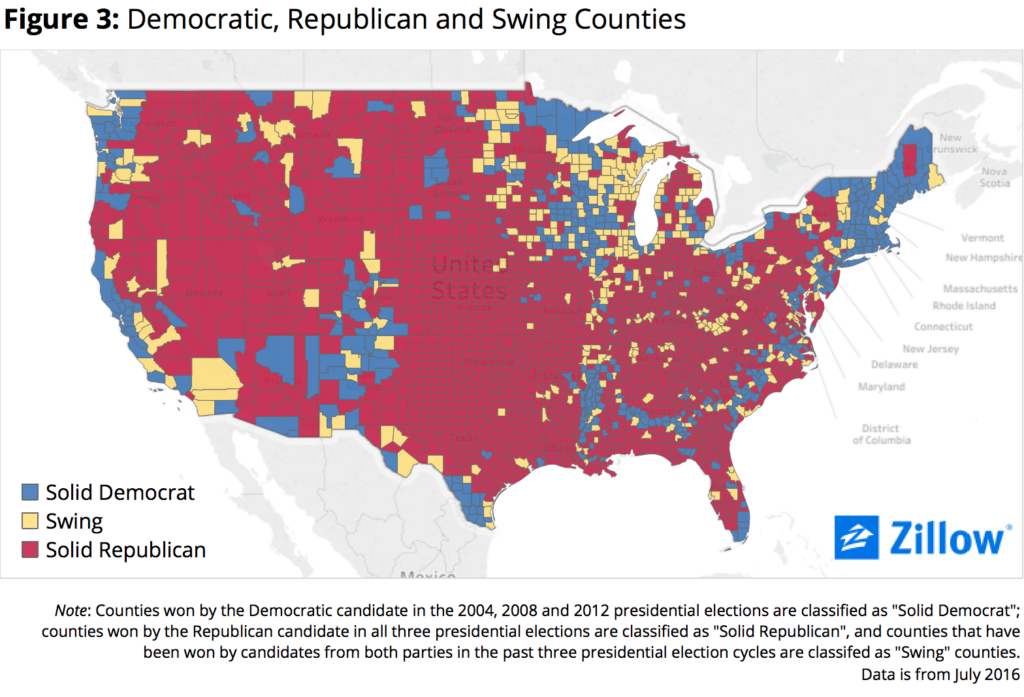
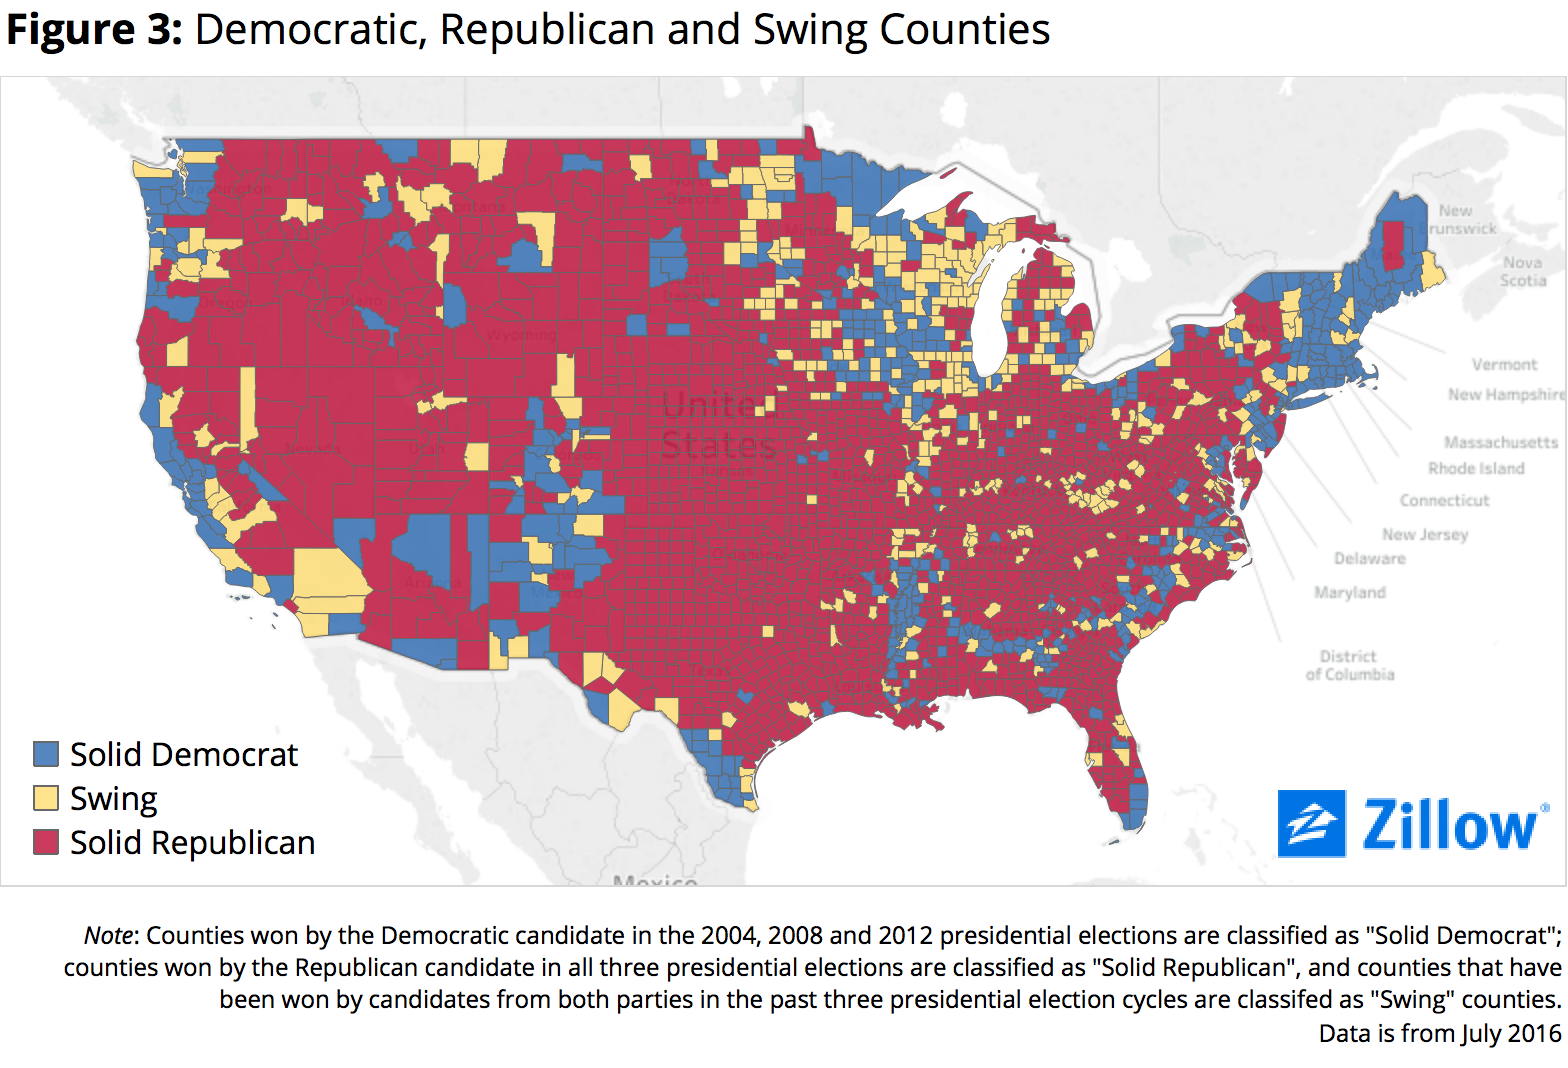
 We classified counties as either solidly Democratic, solidly Republican, or swing counties based on the candidate who won the county in the 2004, 2008 and 2012 presidential election cycles. Counties won by the Democratic candidate in the past three presidential election are classified as “Solid Democrat,” while counties won by the Republican candidate in the past three presidential elections are classified as “Solid Republican.” Counties that have voted for both Republican and Democratic presidential candidates during the past three presidential elections are classified as “swing” counties. A majority of the large urban areas on the coasts are more solidly Democratic, while the vast, largely rural center of the country leans Republican (figure 3). Critical swing counties are sprinkled throughout the country.


