A Crack in the Code: Why Even Some Tech-Employed Renters Can’t Find Affordable Housing
Just because the average tech renter is doing OK, we shouldn’t think everyone in the field is having an easy time making ends meet.

Just because the average tech renter is doing OK, we shouldn’t think everyone in the field is having an easy time making ends meet.
An analysis of the salaries earned and housing costs paid by tech workers nationwide can teach us valuable lessons about the dangers of making broad assumptions based on averages.
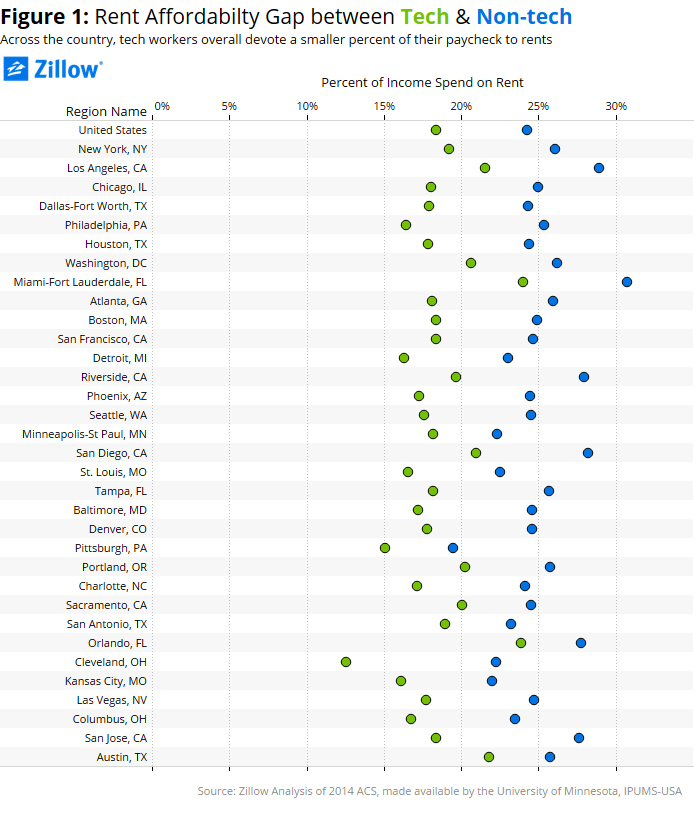
The average U.S. tech-employed renter is doing pretty well for himself.[1] He’s spending only 18 percent of his income on rent, compared to 24 percent for the average renter nationwide.[2] That means he has more disposable income and/or extra savings for things like an emergency medical payment or a down payment on a home if/when he decides to buy one. And this isn’t just a broad, national trend – every one of the largest metro areas analyzed nationwide shows a similar trend (figure 1).
 But don’t make the mistake of conflating the average tech renter with all tech renters. Across the wide (and growing) field of tech careers,[3] there’s a substantial spread in the chunk of their paychecks tech renters sign over to their landlords each month. Comparing rent affordability for tech workers in the 25th percentile to the 75th percentile demonstrates this spread (figure 2).
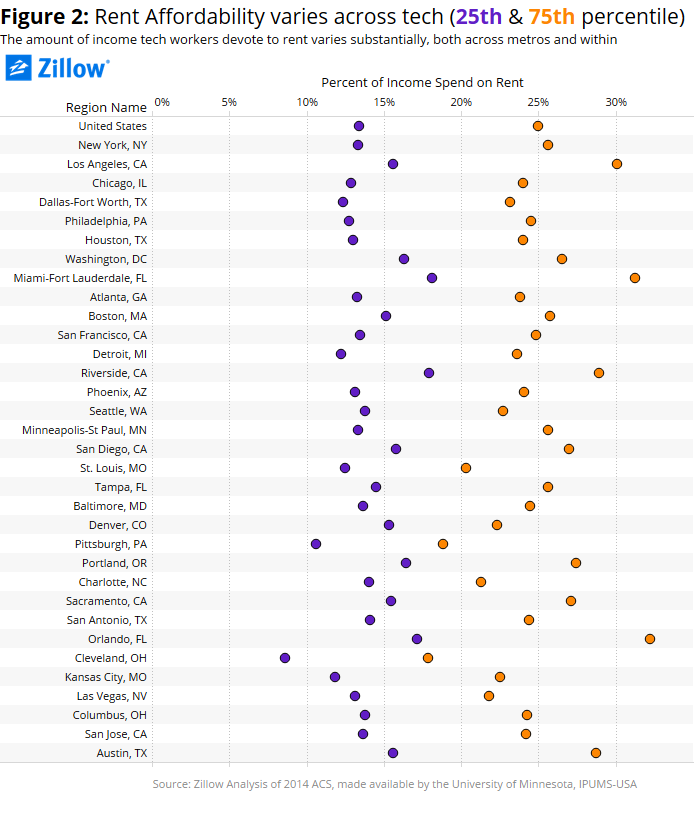 In the U.S. as a whole, 25 percent of tech renters are spending 13 percent or less of their income on rent. At the other end of the spectrum, 25 percent of tech renters are spending 25 percent or more of their income on rent. Every large metro analyzed shows a similar pattern: A 10-to-15 percentage point gap between the most-rent-burdened and least-rent-burdened tech renters. And in almost every top market, the rent affordability gap between the 25th and 75th percentile is larger than the gap between the average tech-employed and non-tech-employed worker.
What’s driving the gap? Incomes are the obvious answer. If you think every tech worker is doing well for themselves, think again (figure 3).
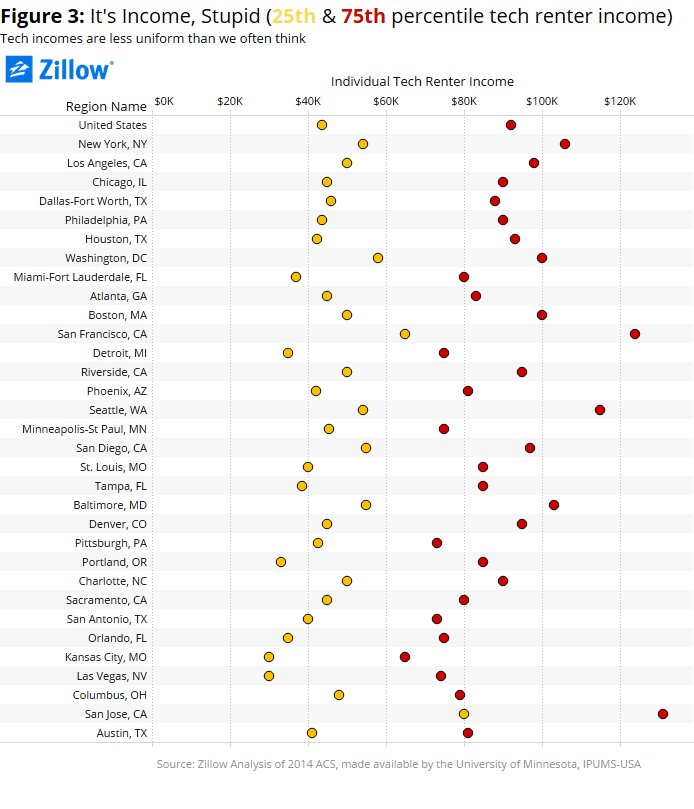 Nationwide, the 25th percentile tech-employed renter brought home $44,000 per year in 2014. In San Francisco, the 25th percentile tech-employed renter earned $65,000 in 2014. Assuming that San Franciscan, tech-employed renter wants to spend no more than 30 percent of their income on rent (the share-of-income-spent-on-housing threshold most prudent advisors recommend staying below), they would have roughly $1,600 to spend on rent per month.
Want to see a magic trick? Watch as San Francisco’s rental stock available at that price range disappears right before your eyes!
 It doesn’t get much better if that 25th percentile tech-employed renter in San Francisco is looking for a larger apartment to share with a roommate. Two-bedrooms in the $3,200/month range are almost equally hard to find.
And the earlier reference to the average tech worker as male wasn’t accidental or meant to be insensitive. Not only are women underrepresented in the field of tech (just 25% of all tech workers nationwide are female), but women are also twice as likely to be in the lowest quartile of the tech-renter salary distribution as in the top quartile. The same goes for both black and Hispanic tech renters.
Just because the average tech-employed renter is doing OK, we shouldn’t think everyone in the field is having an easy time making ends meet.
[1] Wait for it…
[2] The data for this analysis comes from the 2014 American Community Survey. Microdata provided by IPUMS through the University of Minnesota. Affordability calculations are computed at the household-level. Salary calculations are done at the person-level.
[3] To determine tech careers we pooled 14 occupation codes from ACS. 0110, 1005, 1006, 1107, 1106, 1007, 1030, 1050, 1010, 1020, 1060, 1105, 1400, and 7900.
