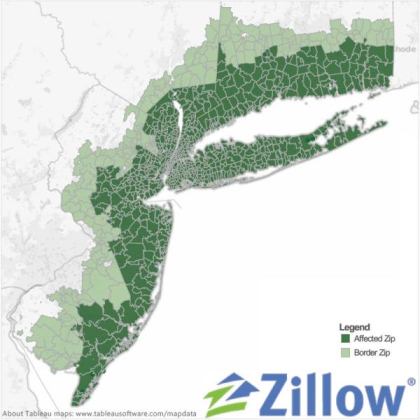
 In this research brief, we take a closer look at how Hurricane Sandy has affected the housing markets in selected ZIP codes in CT, NJ and NY. While it is still early to tell the long-run impacts Sandy might have made, we considered how affected ZIP codes faired in the three months after Sandy made landfall vs. the ZIP codes bordering the affected ones. To classify the most-affected ZIP codes, we used a FEMA list of ZIP codes where Individual Assistance was granted before or on 11/4/2012. Then to create a set of ZIP codes to compare to, we looked at closest and next closest bordering ZIP codes to the most-affected areas. The map to the left shows the two regions compared, with the most-affected ZIP codes closest to the coastline in dark green. The bordering ZIP codes are light green. The most-affected ZIP codes group contains 898 ZIP codes; the border group contains 197 ZIP codes.
To compare the two areas, the median percent change from October 2012 (the month in which Hurricane Sandy occurred) to January 2013 and year-over-year change from January 2012 to January 2013 was calculated for number of listings, listing price and sale price. Sample sizes are in parentheses after the metric; significance is in parentheses after the difference.
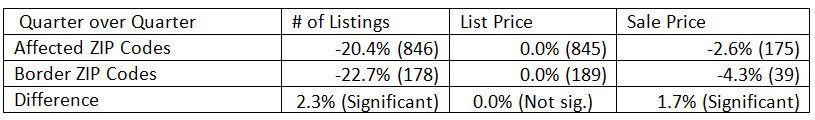
From the above table we see that the number of listings is down on a quarter-over-quarter basis more in the border ZIP codes. There is a statistically significant difference between the two groups. List prices are flat between the two groups. Sale prices are down in both groups, with sale prices down more in the border ZIP codes; this difference is statistically significant.
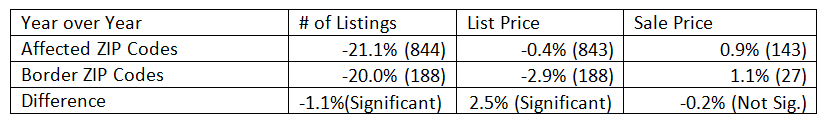
On a year-over-year basis, the number of listings is down more in the affected ZIP codes. This is the opposite of the quarter-over-quarter percent changes. There is a statistically significant difference between the two groups. List prices are essentially flat in the affected ZIP codes and are down almost 3 percent in the unaffected border ZIP codes, a statistically significant difference. Sale prices are up in both groups, but the difference is not statistically significant.
Therefore, in the three months after Hurricane Sandy made landfall, we haven’t seen much of an effect yet. Listings are down across the nation in the past quarter – more so in the affected ZIPs than in the unaffected ZIPs, however there is no definitive impact on the housing market from Hurricane Sandy in terms of list prices. Sale prices are down in the past quarter in affected and border ZIP codes, with prices down more in border ZIPS. However, in all likelihood, we will start to see a shortage of available homes on the market in the affected ZIP codes as the selling season starts to pick up, which will also put upward pressure on home prices.
