Home values have been increasing steadily across the nation since they hit a bottom in October 2011. Since October, they are up 6.5 percent. Just over the past year, home values have appreciated by 5.8 percent. This rate of appreciation is higher than the historical average of around 3 percent. Some metropolitan areas have experienced even higher rates of appreciation. For example, Phoenix has appreciated by almost 23 percent over the past year, Las Vegas is up 18.1 percent and Miami’s home values have increased by 11.5 percent. While home values are still below their peak values in most areas, they are alarmingly high given income levels and mortgage rates. Let’s take a closer look.
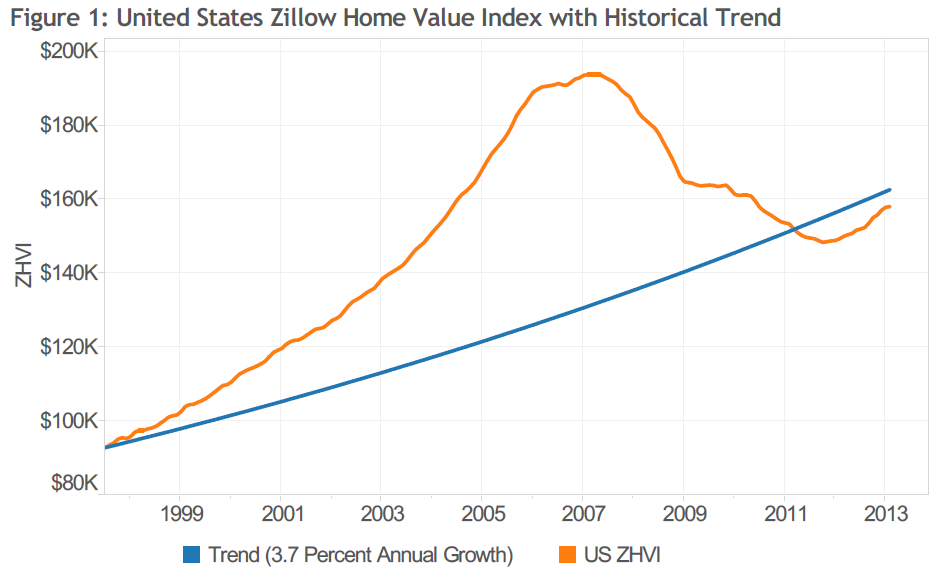 Figure 1 shows where national home values should be had we continued the historical home value appreciation trend of roughly 0.3 percent monthly appreciation and the housing bubble never occurred. According to Figure 1, we are currently still below the level we “should” be at.
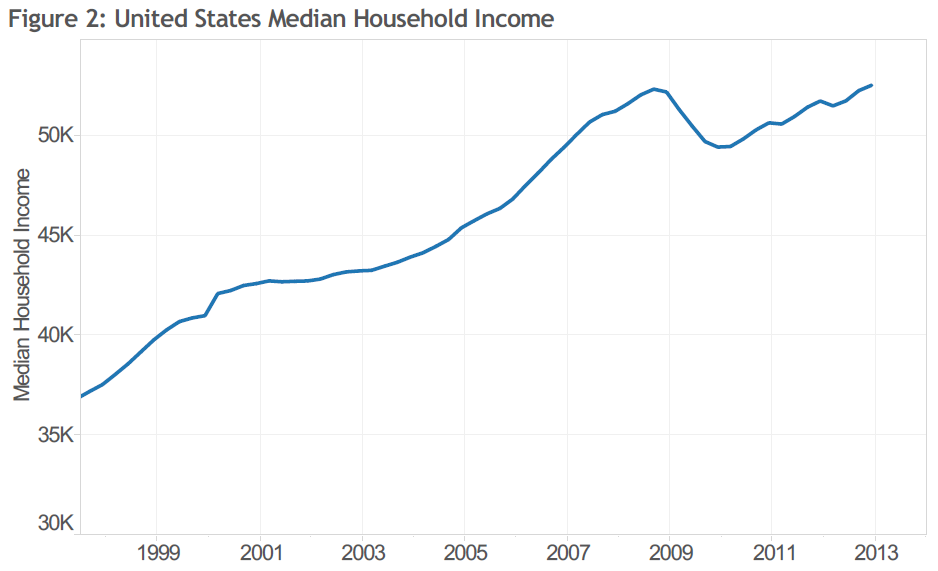
However, incomes have either been stagnant over the last years, or have been making up declines of past year, as Figure 2 shows. Median household income in the United States is currently at 2008 levels. This in turn will impact how much house consumers can afford. To measure this more accurately, we turn to the price-to-income ratio. The ratio compares the median price of homes to the median level of household income in a given area. Specifically, we used the metro-level Zillow Home Value Index, which is a measure of home values for a given metro, together with that metro’s median household income. Median household income is currently available through 2011. For years following 2011, we calculated the median household income by estimating it via the Bureau of Labor Statistics’ wage growth rates.
During the housing boom, the United States price-to-income ratio had increased to a high of 4.0 from a historical average (measured from the first quarter of 1985 to the fourth quarter of 1999) of 2.6. After the market peaked in May 2007, home values fell and so did the price-to-income ratio. Interestingly the ratio never returned to the historical average and in recent quarters has actually started to increase once again, as can be seen in Figure 3. The price-to-income ratio has started to increase again as home values have been appreciating at higher than normal rates as mentioned above.
 Let us now turn to why home values have started to appreciate again, even though they should have kept falling when strictly considering the price-to-income ratio. Recently home values have gained much upward momentum due to inventory shortages across the nation. Underwater homeowners are unable to sell their homes – 27.5 percent of homeowners with a mortgage are in negative equity, limiting the supply of for-sale homes. On the demand side, investors have been very active in the market, taking advantage of lower home values and an uptick in the demand for rental housing by converting lower-end for-sale properties into for-rent properties. Real estate buyers have been enjoying record-low mortgage rates when buying homes, boosting their buying power. Taken together, these factors have been the recipe for bidding wars and homes that sell for more than the listing price, lifting overall home values.
Specifically, mortgage rates, which have been well below 4 percent for a 30-year fixed mortgage, have given consumers an incredible purchasing power boost, as home affordability is at an all-time high. To calculate an affordability index, we first calculate the mortgage payment for the median house price in a metropolitan area, by using the metro-level Zillow Home Value Index for a given quarter and the 30-year fixed mortgage rate during that time period provided by the Freddie Mac Primary Mortgage Market Survey. Then we consider what portion of the monthly median household income goes toward this monthly mortgage payment – our affordability measure. In the nation as a whole, for example, this share ranges from 13 to 27 percent, meaning at its lowest and most affordable point – the current 2012 Q4 observation, the mortgage payment for a median house in the U.S. made up 13 percent of the monthly median household income. In the second quarter of 2006 – at the height of the housing bubble – a monthly mortgage payment made up 24 percent of median household income. Individual metros have a much wider spread between the lowest and highest values. For example, Miami or San Jose. Low mortgage rates have allowed home shoppers to afford more home for their buck. This greater affordability has in turn also helped to increase home values.
While income levels are not expected to grow significantly beyond their normal rate in the next years, mortgage rates will increase as the Federal Reserve decreases their quantitative easing efforts. With increasing mortgage rates, buying power decreases and affordability levels will return closer to their historical averages. In turn, the price-to-income relationship will once again be too high as home values are no longer sustained by demand fueled by low mortgage rates. Home values will have to either remain stagnant, while incomes catch up, or – the more likely scenario – home values will decrease. This will especially be the case in those markets that have seen strong home value appreciation.
In conclusion, we believe that current home value appreciation is not sustainable and is due to inventory shortages and more importantly record low mortgage rates. In the future we will see stagnant or depreciating home values and a price-to-income ratio that is more in line with its historical average.

