Where It Makes the Most Sense to Buy This Winter

Trying to time the housing market, like trying to time any market, is a bad idea. Even the experts make mistakes, and a home is the most valuable asset that most people will ever own, so it’s especially important not to gamble with it.
In the end, the best time to buy a home is always when the time is right for an individual buyer – often when they’re financially ready, when they’re having a major life event that requires upsizing or downsizing, or when they’re moving to a new area.
For potential home buyers whose stars are aligning in one or more of these ways, this winter could be an excellent time to buy. Although mortgage interest rates are rising – already putting gains in mortgage payments ahead of home value growth – they are poised to climb further over the next year. Rent appreciation has been slow (or even negative) across the country but is expected pick up as more potential buyers delay because of the interest-rate squeeze. At the same time, for-sale listings with a price cut are becoming more common as sellers who priced aggressively in late summer are finding the market isn’t quite as hot as it was just a few months ago.
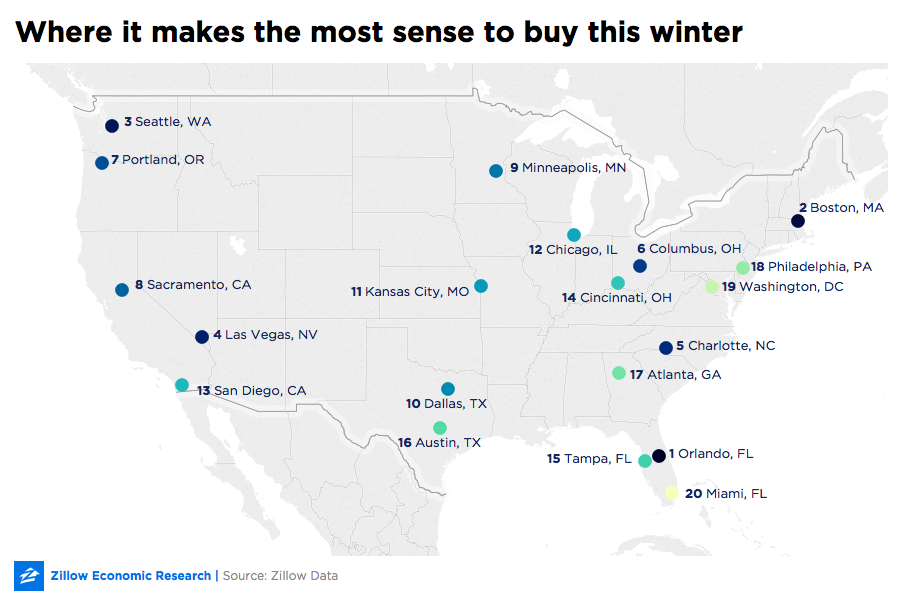
For those sideline buyers looking to make a move before rents and mortgage payments rise further, here are 20 metro areas where it makes the most sense to buy this winter, based on an index we developed:
And here are five metros where it makes the least sense, based on those same rankings:
Of course, there may be other compelling reasons to buy in low-ranked markets such as Indianapolis, Pittsburgh and Phoenix. But expect that price cuts might not be as widespread or rent appreciation not as robust over the next year.
Here are the three factors that went into our index:
Here are the metro areas ranked according to that index:
[i] Mortgage affordability is the portion of the monthly median household income that goes toward a monthly mortgage payment for a median-priced home, assuming a 20 percent down payment and a 30-year fixed mortgage.
[i] Mortgage affordability is the portion of the monthly median household income that goes toward a monthly mortgage payment for a median-priced home, assuming a 20 percent down payment and a 30-year fixed mortgage.
| Rank | Metropolitan Area | Change in Listings with a Price Cut | Projected YOY Rent Change | Affordability[i] | Median Home Value |
|---|---|---|---|---|---|
| 1 | Orlando, FL |
6.8% |
1.4% | 20.2% | $231,000 |
| 2 | Boston, MA |
3.9% |
3.1% | 25.8% |
$458,000 |
| 3 | Seattle, WA |
11.6% |
3.3% | 28.6% |
$486,600 |
| 4 |
Las Vegas, NV |
9.8% | -0.1% | 22.5% |
$273,800 |
| 5 |
Charlotte, NC |
4.2% | 2.9% | 15.1% |
$199,400 |
| 6 | Columbus, OH |
4.0% |
1.9% | 14.1% |
$184,200 |
| 7 | Portland, OR |
4.6% |
3.7% | 26.1% |
$391,400 |
| 8 | Sacramento, CA |
5.3% |
-0.1% | 28.8% |
$400,600 |
| 9 |
Minneapolis, MN |
1.9% |
1.5% |
16.7% |
$263,300 |
| 10 | Dallas, TX |
2.5% |
1.4% | 16.7% |
$233,200 |
| 11 | Kansas City, MO |
2.5% |
3.2% | 13.8% |
$185,500 |
| 12 | Chicago, IL |
3.2% |
1.2% | 15.6% |
$222,200 |
| 13 | San Diego, CA |
10.0% |
0.9% | 37.9% |
$589,200 |
| 14 | Cincinnati, OH |
2.4% |
4.1% |
12.5% |
$164,500 |
| 15 | Tampa, FL |
5.9% |
-0.3% | 18.7% |
$208,400 |
| 16 | Austin, TX |
-0.6% |
1.5% | 19.3% |
$300,600 |
| 17 | Atlanta, GA |
3.2% |
0.7% | 15.2% |
$209,700 |
| 18 | Philadelphia, PA |
-1.3% |
1.6% | 16.1% |
$229,300 |
| 19 | Washington, D.C. |
0.5% |
0.7% | 19.4% |
$401,000 |
| 20 | Miami, FL |
5.5% |
0.7% | 24.9% |
$278,400 |
| 21 | Houston, TX |
6.8% |
-0.3% | 15.1% |
$200,900 |
| 22 | San Jose, CA |
8.8% |
0.3% | 53.5% |
$1,288,700 |
| 23 | Baltimore, MD |
0.6% |
1.1% | 16.0% |
$265,600 |
| 24 | Los Angeles, CA |
6.5% |
0.3% | 45.0% |
$647,100 |
| 25 | Denver, CO |
-1.1% |
3.4% | 25.3% |
$398,400 |
| 26 | Phoenix, AZ |
0.3% |
0.2% | 20.2% |
$258,300 |
| 27 | St. Louis, MO |
0.6% |
0.9% | 12.6% |
$163,100 |
| 28 | Detroit, MI |
2.1% |
0.3% | 12.9% |
$157,200 |
| 29 | San Francisco, CA |
5.4% |
0.0% | 44.9% |
$961,200 |
| 30 | Riverside, CA |
5.9% |
-0.5% | 28.3% |
$362,000 |
| 31 | San Antonio, TX |
-3.2% |
0.5% | 15.4% |
$187,800 |
| 32 | Cleveland, OH |
1.5% |
0.3% | 12.7% |
$142,700 |
| 33 | Pittsburgh, PA |
0.7% |
0.5% | 11.7% |
$142,300 |
| 34 | Indianapolis, IN | 1.6% | 0.1% | 12.5% |
$157,200 |
