Zillow Weekly Market Report, Data Through Dec. 5
Driven by still-strong demand, the housing market remains remarkably robust heading into what is typically the slowest time of year for sales. The trend of accelerating price growth over 2019 that began in May carried on, widening the year-over-year gap in both median list and sale prices. Pending sales are easing down but continue to remain well-above where they were at this point in 2019. Homes continue to sell incredibly fast for this time of year to meet the demand, and declines in new for-sale listings (likely due to concerns over rising COVID cases) are resulting in further inventory drops.
Here are the key U.S. housing market stats for the week ending Dec. 5:
Prices continue to post gains over 2019
- Median list price was up 12.1% year-over-year, to $337,475, widening the gap in price growth over 2019 to new heights. Median list prices have fallen 1.4% over the past three months, but the seasonal deceleration is more “foot off the gas” than the 4.2% “ease onto the brakes” decline over the same period in 2019.
- Median sale price rose to $291,850 in the week ending Oct. 24, 13.5% above 2019. Prices were up 0.3% over the previous week. Sales prices trending up in late October illustrate the intense demand at play long after a typical sales season; last year, median sale price peaked in early July.
Inventory hole deepens as new listings fall
- Total inventory on the market fell 2.2% from the prior week, the latest in a long line of weekly decreases that began in early June. Inventory is down 34% from the same time last year.
- Newly listed for-sale inventory was down 10.8% compared to the same time last year, and fell 10.6% week-week.
Pace of Pending sales still brisk heading into winter
- Newly pending listings are up 15.8% compared to 2019, but down 4.2% since last week. Sales are still extremely brisk given the timing — late December and January are typically the slowest months for sales.
- Very short time on market indicates enduring strong demand, so slowing pending sales figures may be attributed to an overall lack of inventory and dearth of new listings. Rising coronavirus infection rates and stay-home orders across the U.S. may also be playing a part.
- Typical time on market for listings was just 15 days, one day longer than the prior week but a full three weeks (21 days) shorter than at this time in 2019.

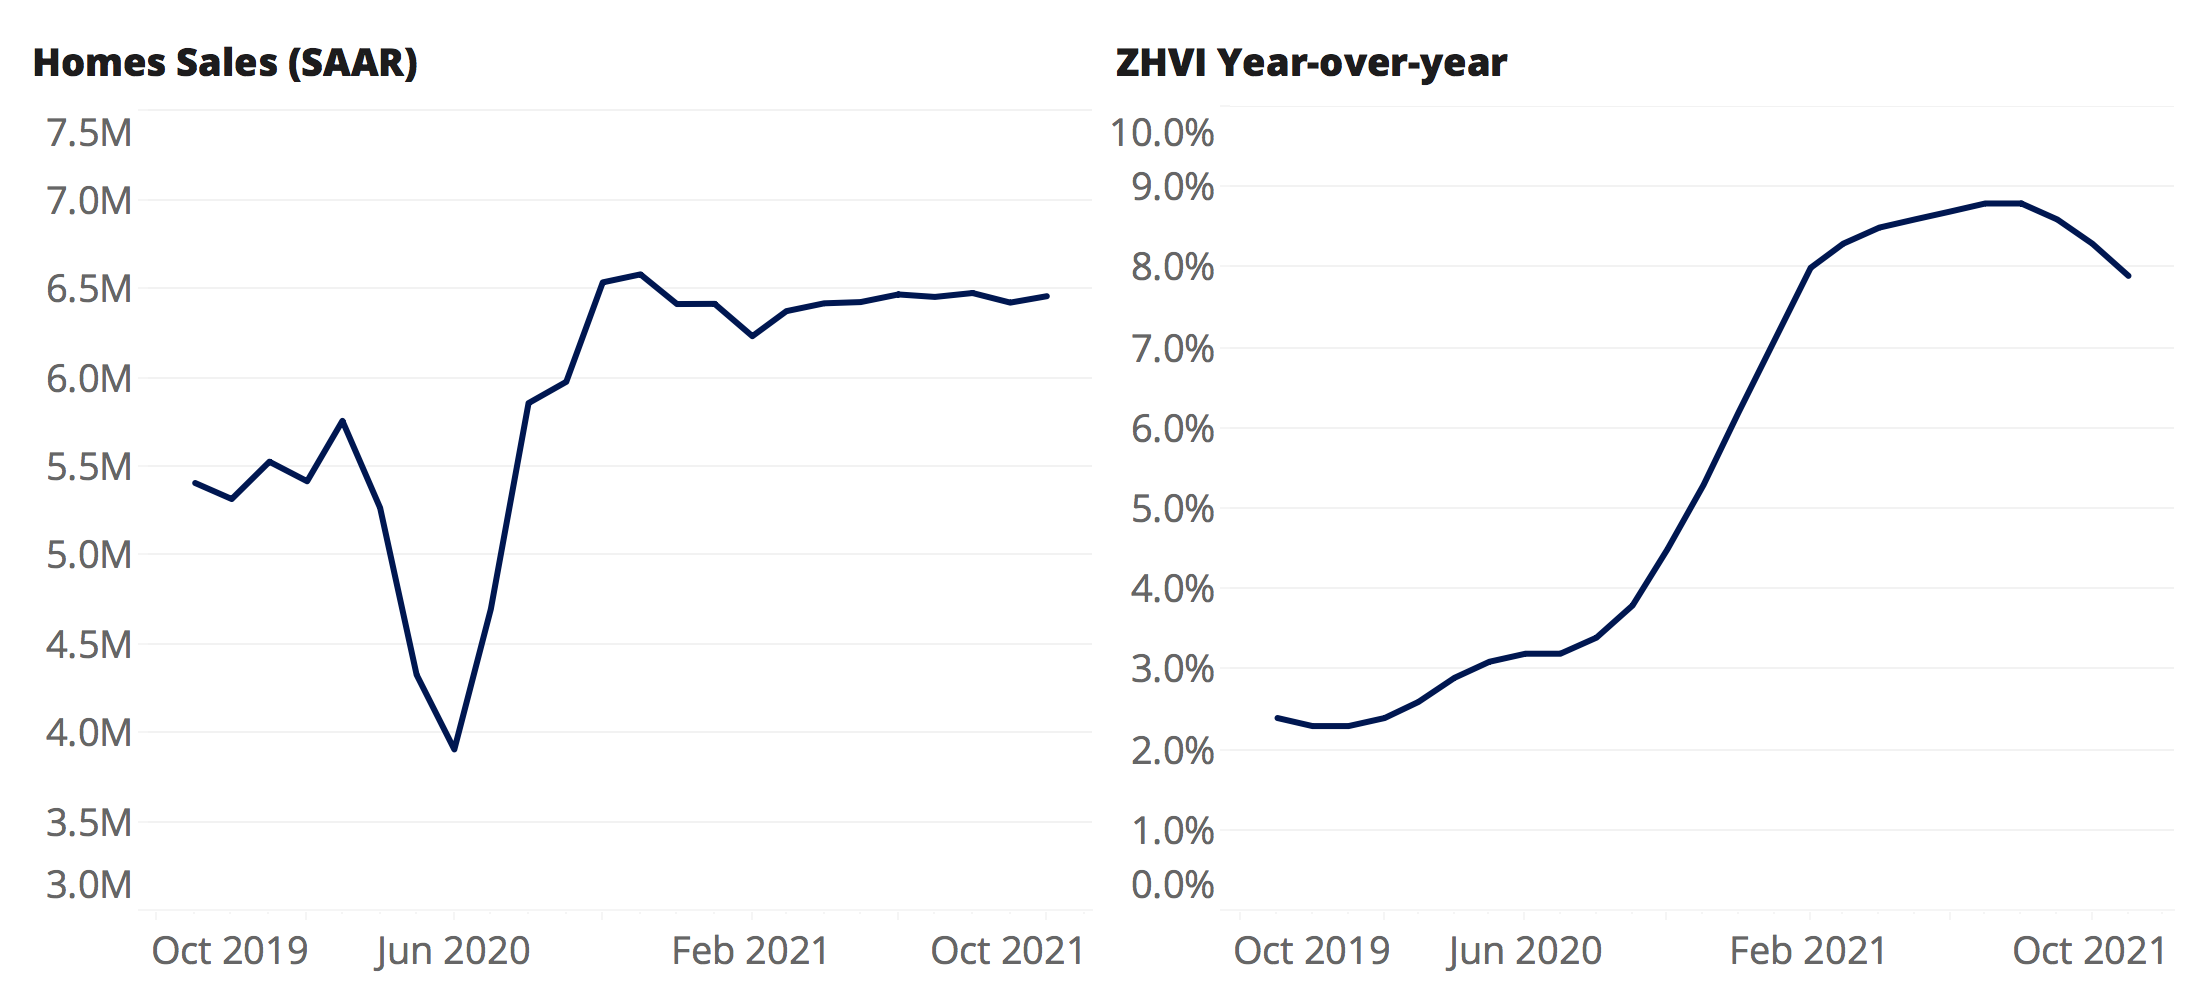
Home values expected to grow another 7.9% over the next 12 months
- This outlook is more optimistic than last month’s: In September, we expected a 7% increase in home prices through September 2021.
- In October, quarterly ZHVI growth was 2.6% — the strongest three-month growth recorded since 2005.
Home sales will remain near their current, elevated levels well into 2021
- In October, there were 6.85 million sales of existing homes (at a seasonally adjusted annualized rate — the number of homes that would sell in a year based on that month’s sales volume), up 26.6% from October 2019 and the strongest level since 2005.
- We expect this torrid pace to moderate slightly but remain elevated over the next year, averaging 6.42M through September 2021. That would mark the strongest 12-months for home sales since 2006.

Methodology
The Zillow Weekly Market Reports are a weekly overview of the national and local real estate markets. The reports are compiled by Zillow Economic Research and data is aggregated from public sources and listing data on Zillow.com. New for-sale listings data reflect daily counts using a smoothed, seven-day trailing average. Total for-sale listings, newly pending sales, days to pending and median list price data reflect weekly counts using a smoothed, four-week trailing average. National newly pending sales trends are based upon aggregation of the 38 largest metro areas where historic pending listing data coverage is most statistically reliable, and excludes some metros due to upstream data coverage issues. For more information, visit www.zillow.com/research/.
Click here to read past editions of Zillow’s Weekly Market Report.