Here’s Where Housing Assistance Falls Short
Only about a quarter of people who are eligible for federal housing assistance nationwide actually receive it. The largest form of assistance is Housing Choice Vouchers -- and in many markets where rents are rising quickly, voucher holders scramble for places to live, because the value of their vouchers isn’t keeping pace with market realities.
- In most of the country’s largest counties, there are a small number of listings available for people with rental vouchers.
- Voucher holders have significantly fewer listing options in areas where rent has climbed fastest over the last several years.
- There are also fewer choices for voucher holders in places where rental assistance most lags rent growth.
Only about a quarter of people who are eligible for federal housing assistance nationwide actually receive it. The largest form of assistance is Housing Choice Vouchers, which offer housing security and freedom of residential choice for millions of lower-income renters. Unfortunately, receiving a voucher—something people can wait for years to achieve—is sometimes just the beginning. In many markets where rents are rising quickly, voucher holders scramble for places to live, because the value of their vouchers isn’t keeping pace with market realities.
Vouchers are typically worth the difference between 30 percent of a household’s income and the market-rate rent price—assuming the rent does not top the “Fair Market Rent” (FMR) determined by the U.S. Department of Housing and Urban Development (HUD). The efficacy of vouchers depends greatly on an adequate supply of rental units at or below the FMR.
We find that in most large counties, FMRs—and therefore rental assistance payments—don’t keep pace with rising rents and contribute to a low supply of rental listings available to people who rely on vouchers.
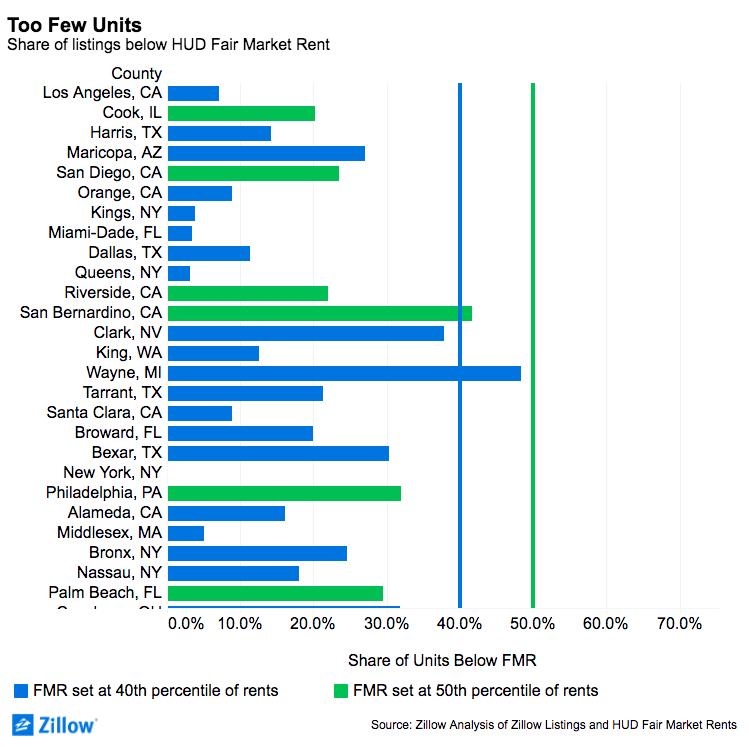
Too Few Units
In many places, the supply of voucher-suitable units is tighter than what HUD estimates when it sets its payment policies. In each of the 100 largest U.S. counties[i], we looked at the proportion of Zillow rental listings[ii] advertised below the local FMR. We found that in three-quarters of the counties, fewer than 40 percent of listings were rentable for voucher holders. In Los Angeles, Miami-Dade, and San Francisco counties, less than 10 percent of advertised listings are rentable for voucher holders.
HUD determines FMRs—and how much it will fund per voucher in each market—using the assumption that the voucher payment should be enough to rent two out of every five rentals that hit the market.
According to HUD, the FMR is set at the 40th percentile to ensure voucher holders are able to access a broad range of suitable housing throughout a region. In areas where voucher holders have a demonstrably difficult time securing housing with their vouchers or where voucher holders are particularly concentrated in one area of a region, HUD will authorize FMRs be calculated at the 50th percentile instead.
Many factors can influence the proportion of rentals available to voucher holders, including rising rents, lagging payment formulas, housing market variations across large regions, and incomplete data.
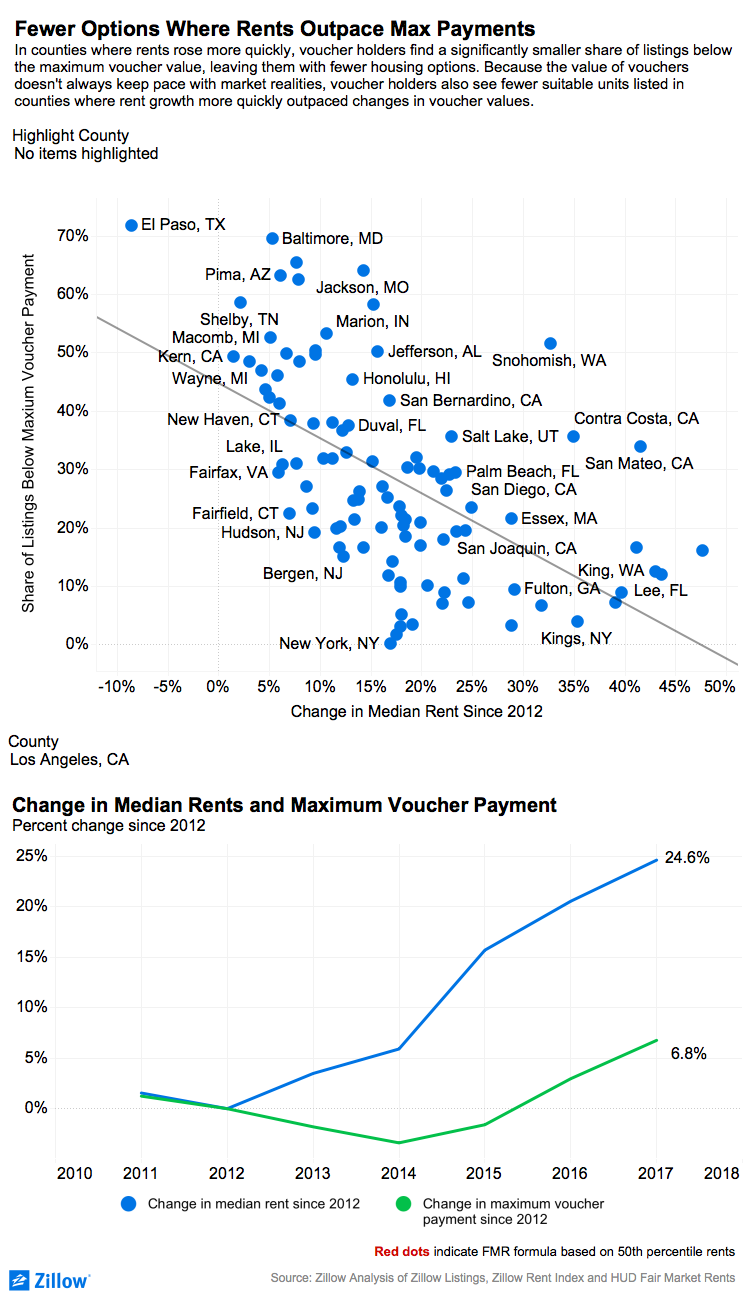
Hot Rents and Tepid Assistance
In counties where rent has grown the fastest, there are significantly fewer voucher-suitable rental choices.
It becomes a major issue for voucher holders when the value of their assistance fails to keep pace, which happens a lot in those same hot markets. We also see a smaller proportion of listings suitable for voucher holders in places where yearly growth in FMR most lags behind yearly change in median rents.
In Los Angeles County, where rents have risen 24.6 percent since 2012 and the HUD payment amount per voucher has grown 6.8%, the share of units available to voucher holders is less than 10 percent. For contrast, in Shelby County, where Memphis, Tenn., is located, rents have grown slowly, and local voucher holders have a lot of options. Pierce County, Washington, outside Seattle, shows rent growth and FMR growth moving roughly in tandem. Note the red dots for Pierce County and some other counties, which indicate where HUD approved an FMR standard to switch from capturing 40 percent to capturing 50 percent of the rental market—and in some cases, the other direction. If the 40th percentile and 50th percentile FMRs were accurately calibrated, you would expect a 10 percent jump or fall in year-over-year FMR change at each switch point as you see in Pierce County.
Geography and Mobility
Another reason for the lack of units available to voucher holders in some counties is the wide area for which FMRs are calculated. FMRs often incorporate multiple counties where less expensive housing in one county might offset more expensive housing in another. However, our previous research looking across broader HUD areas and MSAs, show many larger regions have a shortage of voucher-suitable units.
Geographic disparities within HUD areas matters not just because of the dearth of voucher-qualified rentals it might create. To foster upward mobility among voucher holders who are climbing out of poverty, the units also need to be located in a variety of areas—including places where they and their children will have a better shot at climbing the socio-economic ladder. In regions where the highest proportion of units available for voucher holders are on the periphery, commute times, school choice and other factors can affect families’ ability to succeed.
Policy Implications
Rent affordability is a two-sided coin: the price tag and the income used to pay the bills. Affordable housing policies can address either side of this coin. A few possibilities for addressing the shortage—and uneven placement—of voucher-eligible rentals:
- Short-term policy ideas given the current dynamics of the rental market:
- Make sure vouchers are a useful tool and get into the hands that need them by funding HUD’s Section 8 Housing Choice Voucher adequately, given the high need and increasing rents.
- Better calibrate FMRs so that each voucher is most effective and voucher holders are able to use them to acquire stable and sufficient housing. First, HUD could incorporate data from other entities that aggregate rental listing information. With more timely and more granular data, HUD could better account for areas where rents rise more quickly. Second, HUD could calculate FMR for smaller areas, so that there is a broader array of neighborhoods and areas attainable for voucher holders across a metro. The Small Area Fair Market Rents program was meant to calculate rents at a ZIP code level and experienced early success in increasing options in high-rent ZIP codes until broader implementation of the new formulas were recently delayed.
- Long-term plans to address rental affordability in future markets:
- Keep rent prices down. To some degree, this means building affordable housing using grants and tax credits at the federal level and using inclusionary and incentive zoning policies at local level. To truly keep rents from skyrocketing in the long term, however, pro-growth land use policies at the neighborhood and city levels would allow markets to create rental housing to meet burgeoning demand—especially in high-cost areas like Seattle, Boston, and Los Angeles. Without a robust and sufficient supply of rentals, the federal government will continually spend more to house the same number of low-income families with housing vouchers.
- Finally, there is likely to be a continuing need in U.S. policy to address the income side of rent affordability. This means investments in policies to grow the economy and combat recessions and unemployment, alongside a revamped commitment to safety-net social and economic policies that combat poverty.
Data Caveats
We acknowledge it is likely that online real estate listings, like Zillow’s, may disproportionately miss some less-expensive rental properties that are instead advertised in online classifieds, offline or by word-of-mouth. But to our knowledge, there is no comprehensive national database of rental listings, online or otherwise, and Zillow Group Rentals is the nation’s largest online rental network. We don’t expect missing some of the least-expensive rentals to be a problem that is more or less severe in some areas compared to others. And finally, it is well understood that the payment limits set by HUD can lag the reality of the housing market because of a reliance on outdated Census data and inflation adjustments that don’t keep pace with real estate appreciation. Regardless of the exact share of units available, it’s clear that in many markets, voucher holders are significantly limited in their options.
[i] HUD sets FMRs at either the Metropolitan Statistical Area, HUD’s own definition of a Metro Area, or at the county level for non-metro regions. Most of these lager FMR regions incorporate multiple counties using the same FMR. In a few rare instances a single counties will feature multiple smaller regions with different FMRs. In those rare cases we used a weighted average based on population of those smaller areas to create a singular average FMR for the entire county.
[ii] We used listings for two-bedroom rentals and the 2017 two bedroom Fair Market Rent. HUD calculates FMRs for other home sizes using the two-bedroom as a baseline. We looked at Zillow listing data for all two-bedroom rentals advertised Since January 2017. If a property was listed multiple times, the most recent listing price was used.

