Uncategorized
Accuracy in Context: Why Zillow’s Case-Shiller Forecast Is So Dependable
The S&P CoreLogic Case-Shiller Home Price Indices have long been a benchmark for measuring changes in home price appreciation nationwide and in many individual markets. But despite Case-Shiller’s reputation, weaknesses including an older methodology, limited footprint and substantial lag in timeliness make it fairly easy to predict, and open the door for newer measures like the Zillow Home Value Index to offer a more nuanced and timely look at the market.
- Since 2014, Zillow’s monthly forecast of the Case-Shiller U.S. National Home Price Index has been within 0.25 percentage points of published data roughly 96 percent of the time.
- The broader footprint and more timely publication of the Zillow Home Value Index allows it to more precisely inform our Case-Shiller forecasts.
The S&P CoreLogic Case-Shiller Home Price Indices have long been a benchmark for measuring changes in home price appreciation nationwide and in many individual markets. But despite Case-Shiller’s reputation, weaknesses including an older methodology, limited footprint and substantial lag in timeliness make it fairly easy to predict, and open the door for newer measures like the Zillow Home Value Index to offer a more nuanced and timely look at the market.
Since May 2011, Zillow has offered a forecast of Case-Shiller monthly data for the older 10- and 20-city indices up to one month prior to its publication. Forecasts of the Case-Shiller national price index began in 2014. And since their inception, the Zillow Case-Shiller forecast of monthly seasonally adjusted and annual non-seasonally adjusted changes in all three series (a total of six individual forecasts each month) have been remarkably accurate.
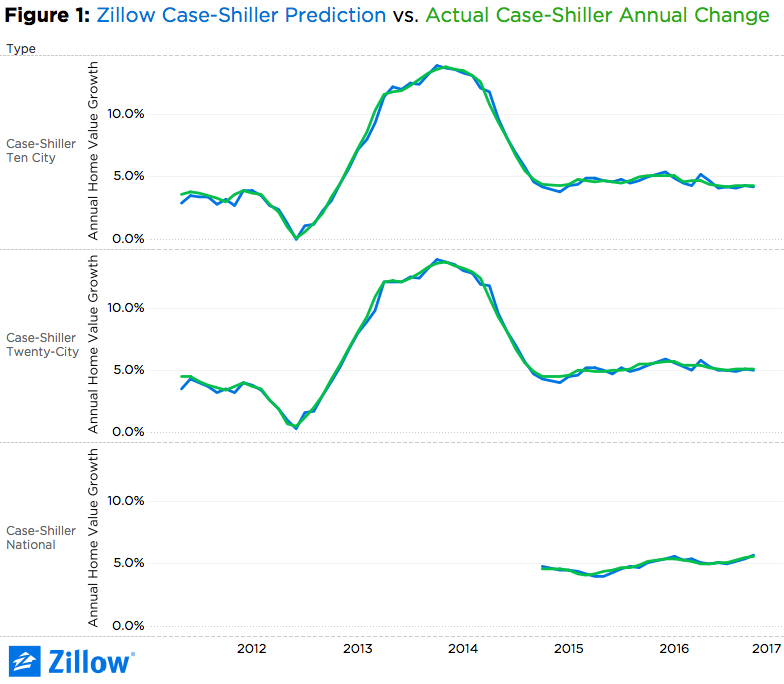 Through the release of November 2016 Case-Shiller data, the median absolute percent error (MAPE) across all monthly forecasts for the six Case-Shiller series we forecast is between 0.1 and 0.3 percentage points. Our forecast of the national index has been within 0.25 percentage points of published data roughly 96 percent of the time. The 10-city index forecasts have been within 0.25 percentage points 61 percent of the time, while the 20-city forecasts have been within that range 68 percent of the time (figure 1).
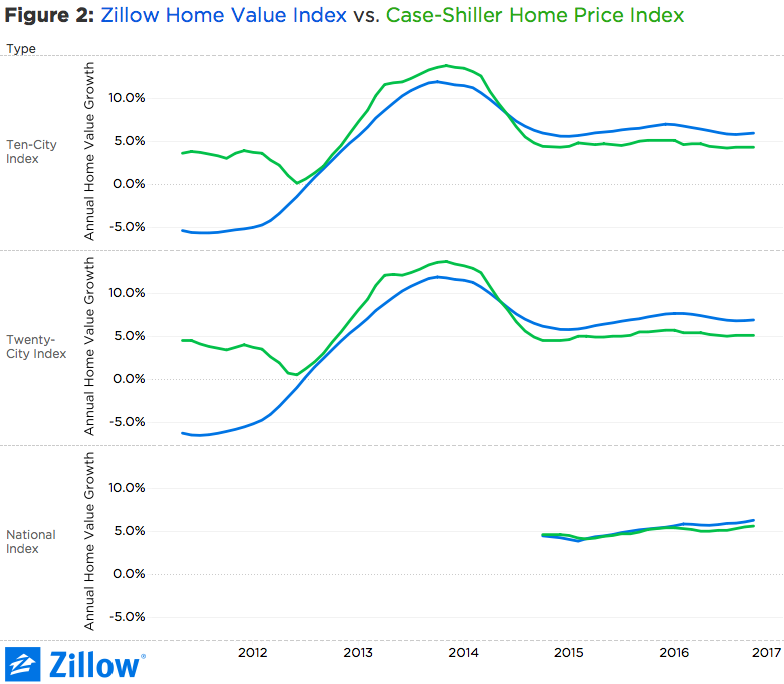
The success of the Zillow Case-Shiller forecast isn’t because of simple luck or a mole inside Case-Shiller’s headquarters. Rather, much of it is attributable to the most powerful tool we possess for gaining insight into local housing market movements – the Zillow Home Value Index (ZHVI) itself. At its core, the ZHVI is essentially the median of individual home value estimates (Zestimates) calculated daily on more than 100 million homes nationwide. This data is both collected at greater frequency and available on a bigger set of homes than that collected by Case-Shiller, enabling us to glean a far more timely picture of market changes and dynamics, which helps inform our forecasts. With few exceptions, movements in ZHVI are generally echoed by Case-Shiller data released more than a month later (figure 2).
 Without getting too far into the weeds (although we’re certainly happy to for anyone interested), much of the differences in timeliness and levels between ZHVI and Case-Shiller are tied to differences between Zillow’s hedonic imputation approach and Case-Shiller’s repeat sales methodology. In order to measure appreciation for an individual home, Case-Shiller looks at a home’s sale history, and measures the price gains/losses from one sale to the next. In order to do this, by nature, a given home must have sold at least twice within a given period – which would exclude newly constructed homes that have only had one owner, and/or homes with only one owner that have been occupied for a very long time. Additionally, Case-Shiller’s methodology includes distressed sales, which can distort market swings. For example, a home bought in a normal transaction prior to the real estate boom, and then sold at a steep discount after a foreclosure during the bust, would show a more dramatic swing in price, even if its underlying value didn’t change as dramatically.
Zillow’s approach, on the other hand, relies on a series of automated estimates of a home’s value, regardless of how many times it has sold (or not sold) in a given period. This allows us to include a broader set of homes in our index, since we can just as easily estimate the value of new homes and homes that don’t turn over very frequently as we do other homes. And because we can include more homes, the ZHVI is also available at a smaller geographic level than the Case-Shiller indices – Zillow publishes ZHVI data at a ZIP code and even neighborhood level.
Zillow’s index also does not include distressed sales, which helps explain some of the divergences in the series during the boom and bust years, when the Case-Shiller index generally exhibits more extreme peaks and troughs. The Case-Shiller model was very likely influenced by rapid changes in value as homes were purchased at discounts as foreclosure resales during the housing bust, exacerbating home prices declines; then perhaps sold again for gains in more normal transactions as the market began to improve in 2012, exacerbating gains.
Finally, because Zillow’s index relies on data calculated daily, our monthly time series is far more timely than Case-Shiller’s. On Tuesday, February 28, Case-Shiller published data through December 2016. ZHVI data for December, on the other hand, was published January 19. Case Shiller data for January won’t be published until March 28 – Zillow’s January data was published February 23.
But Zillow’s forecast of January Case-Shiller data was published the same day December data was released. And if history is any guide, we have lots of reasons to believe the forecast will be pretty close to spot-on.

