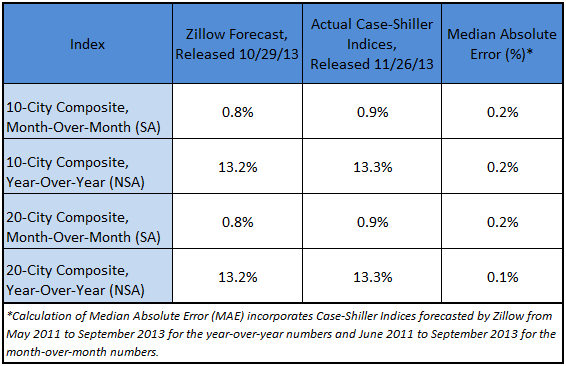
Today, the S&P/Case-Shiller Home Price Indices showed that the non-seasonally adjusted (NSA) September 10- and 20-City Composites each rose 13.3 percent, respectively, on a year-over-year basis, in line with Zillow’s forecast released last month. On a seasonally adjusted (SA) monthly basis, the 10- and 20-City Composites rose 0.9 percent, respectively, from August to September. The table below shows how Zillow’s forecast compared with the actual numbers.
“Honestly, I’m just not sure what to make of these numbers. A slew of recent reports, including Zillow’s October data out today, pending home sales and new home sales, all indicate a slowing market with formerly stratospheric home price appreciation rates beginning to fall back to earth,” said Zillow Chief Economist Dr. Stan Humphries. “Zillow’s own data, which excludes REO re-sales, shows the same markets that dominate the Case-Shiller indices – particularly some of the California markets – to be cooling. This suggests that Case-Shiller’s inclusion of REO re-sales is heavily skewing overall appreciation in these markets. If people are really focused on REO appreciation, they should take a closer look at Case-Shiller. But I think most people are more concerned about the broader market, and I’m not sure Case-Shiller is doing a good job of characterizing that market.”
Our forecasting model incorporates previous data points of the Case-Shiller series, as well as Zillow Home Value Index data and national foreclosure resales. To see our forecast for the October Case-Shiller indices, click here. To see how Zillow’s forecast of the August Case-Shiller indices compared, see our blog post from last month.
