Winter Hasn’t Cooled the Red-Hot Housing Market (January 2021 Market Report)
Annual growth in home values was faster in January than at any point since the years preceding the 2008 Great Recession.

Annual growth in home values was faster in January than at any point since the years preceding the 2008 Great Recession.
Annual growth in home values was faster in January than at any point since the years preceding the 2008 Great Recession — a sign that the red-hot housing market of 2020 did not lose any heat as the calendar turned to 2021.
The U.S. Zillow Home Value Index (ZHVI) rose to $269,039 in January, up 1.1% from December and matching December’s all-time record for monthly growth dating to 1996. The typical U.S. home was worth 9.1% more in January 2021 than it was in January 2020, the fastest annual pace recorded by ZHVI since June 2006 and surpassing December 2013 (8.5%) for the fastest pace recorded in the post-Great Recession era.
Home values were up on the month and the year in all 50 of the largest metro areas tracked by Zillow. Monthly growth in these markets ranged from a low of 0.4% in San Francisco to 2.1% appreciation in Phoenix. Annual appreciation in large markets was as high as 17.1% in Phoenix, and as low as 5.3% in San Francisco.
So why is the market so enduringly hot, especially at a time of year (squarely in mid-winter) when the market is generally calmer? In short: An extraordinary number of home buyers, with budgets supercharged by rock-bottom mortgage interest rates, are competing over a limited supply of homes for sale.
These buyers did not materialize just because of the pandemic, though that may have accelerated the home-buying decision for some. Rather, the bulk of this demand is coming from simple demographics: Members of the massive Millennial generation are now entering their 30s, when folks — pandemic or not — typically buy their first home. The number of Americans aged 25-34 was 12% higher in July 2020 than July 2010, according to Census estimates, rising from 41.2 million a decade ago to 46.1 million by last summer.
Those extra 4.9 million people are represented in the leading edge of young buyers in the market today, and will be a source of demand for the next several years as well. Critically, this influx of would-be buyers will do little to help boost the supply of homes available to buy — unlike move-up buyers, these younger, first-time buyers are not selling a home and putting a property on the market at the same time as they are buying one and taking one off.
At the same time as this demographic wave helps to naturally boost housing demand, rock-bottom mortgage rates are helping all would-be buyers (and many current homeowners) stretch their monthly budgets further. The typical rate on a standard, 30-year, fixed-rate mortgage averaged 2.74% in January, up slightly from historic lows hit in late 2020 but still the second-lowest of any month on record (only slightly above the 2.68% average recorded in December 2020). In large part because of these exceptionally low mortgage interest rates, the monthly mortgage payment on a typical local home for those earning a typical homeowner income in many areas was more-affordable by late 2020 than in years prior — despite rapidly rising prices.
Those low rates are one motivation for many people to buy now, rather than wait. But the elephant in the room remains COVID-19 and its ongoing impact on where and how we choose to live, and what we need and expect from our homes as traditional work-life balances shift. The pandemic has relocated many Americans from office parks to home offices, both creating a need for more home office space and expanding options of where exactly we can call home and still reasonably log on from 9-5. This newfound flexibility in where we could live in turn opened up different, perhaps more-affordable areas to live and work, creating new potential opportunities for affordable homeownership for millions. And the pandemic itself upended traditional spaces in the home, turning kitchen counters into school desks and spare bedrooms into home gyms. All of it forced many consumers into the market to find the home that best balanced their changing needs and desires.
But this huge wave of demand — both natural and COVID-enhanced — isn’t being met with an emerging wave of supply. Shoppers are finding a smaller pool of options to choose from–active inventory–this winter than at any other time in Zillow’s record-keeping. January yet another decline in active inventory from 1.16 million to 1.07 million homes for sale, or about 26% fewer homes than were on the market last January. That shallow pool of inventory is the consequence of two trends that took hold in the second half of 2020: a high volume of sales, gradually draining the pool of listings; and faster selling speeds for those homes that are hitting the market.
Homes that sold this December were on the market for just 17 days at the median, compared to about 42 to 43 days in December of 2018 and 2019. Early data from January suggest this trend continued into the new year. For context, that velocity means that the traditional seasonal doldrums for real estate never materialized this winter. A median of 17 days to pending was faster than the fastest-selling months overall in 2018 and 2019: the spring of 2018, when sale speed reached 18 days to pending in March, April and May.
Among large markets, in absolute terms, homes sold the fastest this December in Columbus, Denver, Kansas City, Memphis, and Raleigh, all of which notched median time on market of less than a week. Large markets with the biggest increases in velocity (or the biggest decline in days on market) between this year and last included Virginia Beach, Hartford, Portland, Ore., and Richmond, Va., all of which saw declines of more than 35 days over the course of the year.
Even so, low inventory on its own doesn’t necessarily mean the flow of new listings is drying up. Roughly as many new listings hit the market in the latter half of 2020 as in the second half of 2019. But the much faster speed of sales means buyers must move quickly to make an offer when they see a home they like, and the lack of alternatives visible at any point in time helps to drive the urgency and chance of multiple offers for each listed home. Those forces are contributing to the price appreciation we see today.
But while the price of purchasing a home is rising exceptionally fast, the cost to rent a home is barely moving at all. The Zillow Observed Rent Index (ZORI) was $1,721 in January, just 0.5% higher than in January 2020. And the flatlining national figures mask a lot of regional variability — rents in many expensive, coastal metros are currently much lower than a year ago–down 9.2% in San Francisco, 8.8% in New York, 7.3% in San Jose, and 6.3% in Boston. Some Sunbelt and heartland metro areas, on the other hand, saw solid rent growth: Phoenix led the top 35 metro areas, with 8.4% annual rent growth, followed by Sacramento (7.6%) and Indianapolis, at 6.9%.
The divergence in trends between the for-sale and rental markets underscores just how unusual, and unequal, the recession triggered by the pandemic really is. Job losses were concentrated among industries and occupations that disproportionately employ renters, while employment quickly recovered for higher-wage workers who tend to be homeowners. And many otherwise well-paid and job-secure renters may have chosen to move out and buy their own homes instead, spurred on by low mortgage rates and/or a need or desire for the kind of homes in the sorts of areas where buying is more beneficial than renting.
Sifting through the data, we can see some glimmers of early evidence for a rental market turnaround: rents rose in January from December in Boston, New York and Chicago, suggesting that demand may be starting to recover in those cities. and we believe that as vaccinations continue to roll out, some of the lost shine of urban life will be restored and tenants will come back, boosting rents in 2021. But, as always, more data will be necessary to confirm the trend.
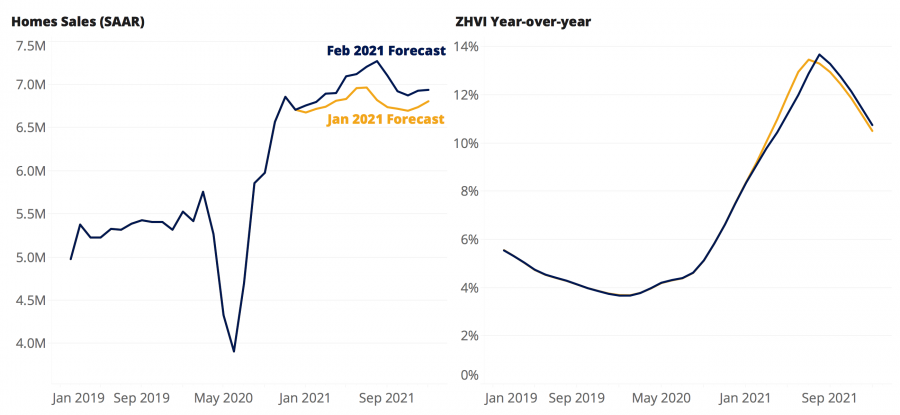
Looking forward, Zillow economists expect home values to grow 10.1% through January 2022 — still very fast appreciation, but down slightly from our last 12-month forecast of 10.5% year-over-year growth through December. Somewhat higher mortgage interest rates and still-uncertain consumer sentiment as the coronavirus continues to spread contributed to the slight downward revision.
But while our expectations for home value growth over the next year have been tempered somewhat, our forecast for existing home sales has been revised up since December, driven by improved pending sales volumes and home purchase mortgage applications. Existing home sales are expected to reach 7 million in 2021, 24.8% more than in 2020, up from an expectation for approximately 6.8 million sales a month ago.
