Zillow Q1 2022 iBuyer Report
In Q1, homeowners sold 12,652 homes using an iBuying service. iBuyer market share was 1.3%.

In Q1, homeowners sold 12,652 homes using an iBuying service. iBuyer market share was 1.3%.
The number of homes sold using an iBuying service fell in Q1, roughly slowing to the same degree as overall home sales amid today’s low-inventory environment. iBuyer market share remained above 1% for the third consecutive quarter.
Instant buyers, commonly known as iBuyers, are home-buying and -selling services that typically buy off-market homes directly from sellers at market rate and, after making light repairs and updates, quickly list them for sale on the open market. In the 43 largest iBuyer markets, homeowners sold 12,652 homes in Q1 using one of three iBuying services included in this analysis: Opendoor, Offerpad and Zillow Offers.
Those iBuyers resold 26,537 homes during the same period, the most ever recorded. This is the third consecutive quarter that iBuyer home resales have set a new high, after a then-record 10,738 homes resold by iBuyers in Q3 2021 and 21,332 homes resold in Q4 2021.
The 12,652 homes sold by homeowners using an iBuying service represent 1.3% of all U.S. home sales last quarter, down from 1.7% market share in Q4 2021. The decline in sales using an iBuying service and iBuyer market share is primarily due to two factors: the winding down of Zillow Offers and an overall slowdown in home sales in the broader market, largely because of record-low inventory. Zillow data shows U.S. home sales fell 21% quarter over quarter in Q1.
The median price of homes sold using an iBuying service fell to $347,000 in Q1. That’s down from a revised $364,900 in Q4 2021 and an all-time high of $371,466 in Q3 2021. The 5% price decline for homes sold using an iBuying service comes as the overall median sale price rose 2% from the previous quarter to about $340,000. The median price of homes sold using an iBuying service consistently outpaces the national median sale price because iBuyers tend to operate in larger, more-expensive housing markets, not because homes sold using an iBuyer are more expensive than a typical home in each market. Of the 32 metro areas for which data is available, the typical home sold using an iBuying service was less expensive than the metro’s overall median sale price in 30 of those markets. Miami and Greensboro were the exceptions.
Of homes resold by an iBuyer in Q1, the median markup — the difference between the purchase price and sale price — was 14%. That’s up from a revised 4.6% in Q4 2021, and is an all-time high for any quarter since 2018, when Zillow began tracking this data.
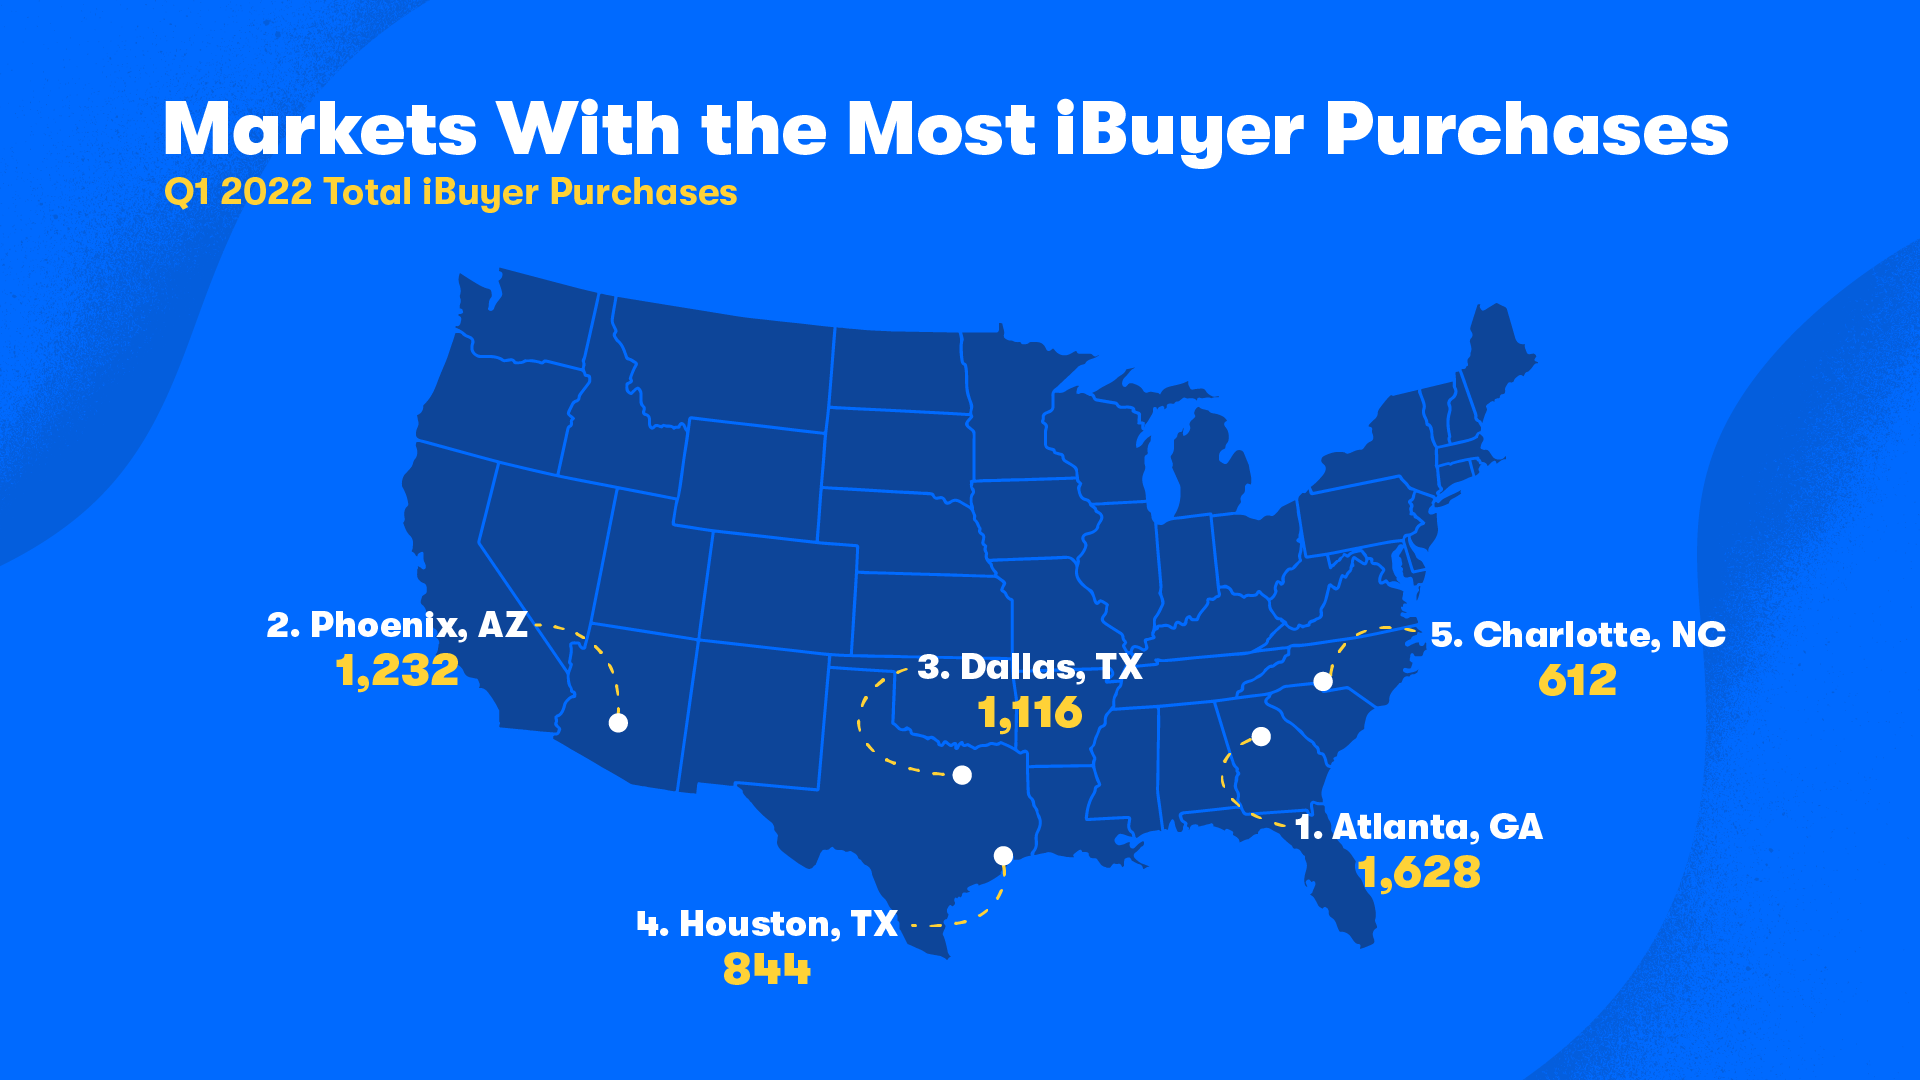
Sun Belt markets continue to see the most iBuyer activity. Atlanta was the top market for homes sold using an iBuying service in Q1, followed by Phoenix and Dallas–Fort Worth. After ranking fifth in Q4 2021, Houston jumped Charlotte for the fourth spot last quarter.
While the volume of homes sold using an iBuying service was greatest in Atlanta, the highest iBuyer market share was in Tucson. In Q1, 6.1% of homes sold in Tucson were sold using an iBuying service, edging out Atlanta (6%), Winston-Salem (5.9%) and San Antonio (5.7%).
iBuyers typically held the homes they resold in Q1 for 120 days, which includes getting the home ready to sell, the time the home spent on the market and the time it took to close. That’s about three weeks longer than the 98 days iBuyers typically held homes before reselling them during the previous quarter.
| Total iBuyer Purchases | iBuyer Market Share | Median Price – iBuyer Purchases | Total iBuyer Resales | Median Markup – iBuyer Resales | ||||||
| Metro Area* | Q1 2022 | Q4 2021 | Q1 2022 | Q4 2021 | Q1 2022 |
Q4 2021 |
Q1 2022 | Q4 2021 | Q1 2022 |
Q4 2021 |
| United States | 12,652 | 21,845 | 1.3% | 1.7% | $347,000 | $364,900 | 26,537 | 21,332 | 14.0% | 4.6% |
| Atlanta, GA | 1,628 | 2,925 | 6.0% | 9.6% | $301,250 | $312,600 | 3,302 | 2,652 | 15.0% | 6.5% |
| Phoenix, AZ | 1,232 | 2,324 | 5.2% | 8.8% | $427,400 | $423,513 | 3,040 | 2,404 | 9.4% | 4.9% |
| Dallas–Fort Worth, TX | 1,116 | 1,655 | 5.1% | 5.8% | $333,700 | $356,193 | 2,043 | 2,064 | N/A | -0.6% |
| Houston, TX | 844 | 1,199 | 3.5% | 4.4% | $270,000 | $293,054 | 1,562 | 1,241 | N/A | 0.1% |
| Charlotte, NC | 612 | 1,228 | 5.6% | 8.5% | $320,000 | $327,934 | 1,439 | 1,195 | 12.5% | 6.0% |
| Tampa, FL | 554 | 999 | 3.3% | 5.3% | $325,000 | $324,150 | 1,187 | 957 | 17.5% | 6.9% |
| Orlando, FL | 482 | 888 | 4.0% | 6.6% | $333,500 | $340,525 | 948 | 882 | 16.4% | 6.1% |
| Jacksonville, FL | 478 | 901 | 5.4% | 8.9% | $299,600 | $299,700 | 1,038 | 739 | 15.7% | 5.6% |
| San Antonio, TX | 478 | 609 | 5.7% | 6.1% | N/A | $283,995 | 859 | 732 | N/A | 1.3% |
| Las Vegas, NV | 402 | 848 | 4.0% | 7.1% | $418,900 | $403,208 | 961 | 861 | 11.0% | 4.6% |
| Austin, TX | 320 | 479 | 4.3% | 5.1% | N/A | $439,745 | 958 | 417 | N/A | -2.0% |
| Denver, CO | 310 | 588 | 3.0% | 4.0% | $533,550 | $532,372 | 721 | 707 | 15.4% | 3.1% |
| Tucson, AZ | 303 | 518 | 6.1% | 9.4% | $303,700 | $310,800 | 585 | 407 | 9.9% | 5.8% |
| Nashville, TN | 282 | 503 | 2.8% | 4.0% | $365,400 | $380,000 | 495 | 584 | 15.4% | 5.3% |
| Riverside, CA | 246 | 541 | 1.6% | 2.9% | $536,000 | $558,567 | 657 | 449 | 12.8% | 3.5% |
| Raleigh, NC | 215 | 601 | 3.7% | 7.5% | $353,000 | $365,000 | 666 | 511 | 15.0% | 5.7% |
| Sacramento, CA | 202 | 438 | 2.9% | 4.8% | $531,748 | $556,000 | 581 | 417 | N/A | 0.4% |
| Portland, OR | 199 | 389 | 2.3% | 3.1% | $513,900 | $504,463 | 542 | 417 | N/A | 1.9% |
| Los Angeles, CA | 191 | 440 | 0.9% | 1.6% | $804,150 | $806,001 | 505 | 554 | N/A | 4.4% |
| Minneapolis–St. Paul, MN | 183 | 339 | 1.6% | 1.9% | $331,450 | $338,100 | 548 | 372 | N/A | -0.9% |
| Lakeland, FL | 179 | 250 | 4.7% | 6.0% | $293,500 | $292,186 | 241 | 214 | 18.4% | 5.7% |
| Daytona Beach, FL | 155 | 179 | 3.3% | 3.5% | $279,100 | $267,400 | 236 | 137 | 14.2% | 11.5% |
| North Port–Sarasota-Bradenton, FL | 85 | 195 | 1.4% | 2.8% | $355,300 | $362,371 | 246 | 143 | N/A | 7.7% |
| Birmingham, AL | 84 | 62 | 2.1% | 1.3% | $217,750 | $227,150 | 52 | 38 | N/A | N/A |
| St. Louis, MO | 82 | 116 | 1.0% | 1.0% | N/A | $224,500 | 109 | 28 | N/A | 10.4% |
| Columbia, SC | 76 | 62 | 2.2% | 1.5% | $205,350 | $208,900 | 58 | 14 | N/A | 15.0% |
| San Diego, CA | 67 | 203 | 0.9% | 2.2% | $728,000 | $710,846 | 307 | 236 | N/A | 4.0% |
| Miami–Fort Lauderdale, FL | 64 | 363 | 0.2% | 1.2% | $396,000 | $397,100 | 281 | 330 | N/A | 2.5% |
| Boise City, ID | 62 | 25 | 1.9% | 0.6% | N/A | N/A | 49 | 10 | N/A | N/A |
| Kansas City, MO | 60 | 55 | 0.9% | 0.6% | $227,950 | $256,200 | 102 | 23 | N/A | N/A |
| Indianapolis, IN | 60 | 80 | 0.8% | 0.8% | $246,800 | $248,400 | 40 | 6 | N/A | N/A |
| Durham, NC | 58 | 169 | 2.8% | 6.0% | $332,750 | $354,500 | 189 | 140 | N/A | 5.5% |
| Winston-Salem, NC | 57 | 72 | 5.9% | 5.2% | N/A | $223,000 | 81 | 67 | N/A | 9.1% |
| Salt Lake City, UT | 55 | 25 | 1.8% | 0.6% | N/A | N/A | 51 | 30 | N/A | N/A |
| Greensboro, NC | 54 | 77 | 4.8% | 4.4% | $236,500 | $217,000 | 86 | 81 | N/A | 8.8% |
| Oklahoma City, OK | 52 | 42 | 0.9% | 0.6% | $199,500 | $177,750 | 36 | 14 | N/A | N/A |
*Table ordered by number of sales using an iBuying service in Q1. Metro areas with fewer than 50 home sales using an iBuying service in Q1 were excluded.
