Zillow Rent Index by Tier: Low-End Demand, High-End Supply
As rent overall continues to grow, rents are growing faster across the board among low-end apartments as demand for more affordable rentals stays hot. But rather than build more units at the bottom end of the market to meet this demand, apartment developers have instead focused their efforts on adding more supply at the high end.
- The majority of all new construction built since 2014 has been at the top of the market in large markets analyzed by Zillow.
- The lack of supply among the least expensive third of rental homes and overall strong demand for rentals is driving up rents.
- Rents among the cheapest apartments are outpacing the growth of the entire rental market in 15 major markets analyzed by Zillow.
- Over the past year, 11 of the 15 housing markets in Zillow’s analysis saw double-digit rent appreciation among low-end apartments.
As rent overall continues to grow, rents are growing faster across the board among low-end apartments as demand for more affordable rentals stays hot. But rather than build more units at the bottom end of the market to meet this demand, apartment developers have instead focused their efforts on adding more supply at the high end.
On an annual basis, median U.S. rents have risen or remained flat in every month for going on four years now. But there isn’t just one rental market, even within a single given area. There are many submarkets depending on the location, size and price of the apartment sought, and strength in some segments of the market can mask weaknesses in others.
Similar to Zillow’s prior analyses of the for-sale market, we divided the rental market into segments based on the Zillow Rent Index[1] to help determine how apartments at the bottom end of the market have fared relative to more upscale digs.[2]
In all 15 major metro markets analyzed, we found that rents among bottom-tier apartments are growing more quickly than median rents overall. In some California markets, annual rental growth at the low end is exceeding 20 percent per year, including Sacramento (up 32.7 percent), Los Angeles (27. Percent), San Francisco (24.6 percent) and San Diego (up 21.7 percent). This increase is playing a big part in deteriorating rental housing affordability in general, especially for the lowest-income Americans that are more likely to rent. Income growth for those earning the least has been weak or flat for years, and trying to manage what are often double-digit increases in rent can quickly stretch already tight budgets to the breaking point.
High End, High Activity
At the high end of the apartment market, the story is more mixed. In some areas, like San Francisco, high-end apartment rents have grown very strongly – even stronger than at the bottom end. But in other large markets, like Boston and Chicago, growth at the high end has been more stagnant.
As with most things in economics, the explanation for the differences in appreciation among bottom- and top-tier apartment rents boils down to supply and demand. Demand for lower-end rentals has been booming at the same time as new supply has been slow to materialize.
We analyzed the number of apartment units constructed over the past three years in the same 15 large markets, and calculated what fraction of these new units[3] were priced at the low end versus the high end of the market. In many areas, less than 10 percent of new apartments have been aimed at the low end of the market, with the bulk of new construction instead focused on the high end.
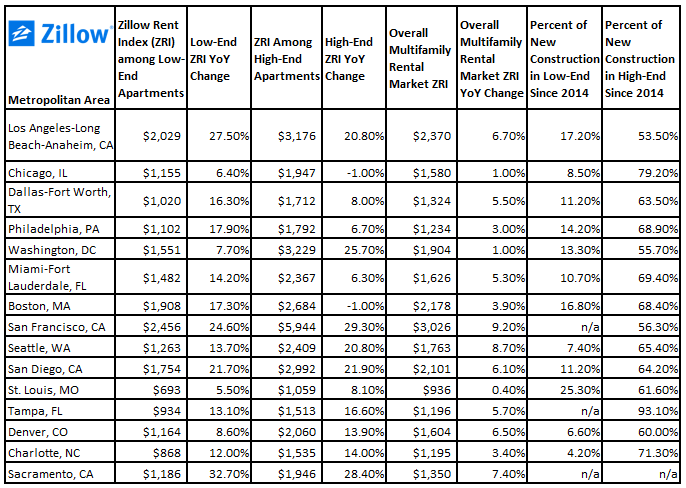 This lack of new supply for lower-tier rentals is helping push prices skyward. In Charlotte, for example, only 4 percent of new construction has been priced at the low end – and low-end rents have risen 12 percent. In areas where construction has been even slightly more balanced, bottom-tier rental growth has been more muted. In St. Louis, 25 percent of new apartment construction has been priced for the low end, helping keep a relative lid on low-end rental price appreciation at a more manageable 5 percent annual pace.
Unless this dynamic of low-end demand being met with high-end supply begins to shift, it is hard to see much relief on the horizon for those intent on finding an affordable place to rent.
[1] The Zillow Rent Index (ZRI) is the median Rent Zestimate® (estimated monthly rental price) for a given geographic area on a given day, and includes the value of all single-family residences, condominiums, cooperatives and apartments in Zillow’s database, regardless of whether they are currently listed for rent. It is expressed in dollars.
[2] Rentals in each metropolitan region are assigned to the bottom, middle, or top tier of rentals based on their estimated rental price. Each tier contains one-third of the rentals in the metro region, and the thresholds defining each metro tier are computed separately for each metro. For data on the middle tier of rentals in this analysis, refer to the Zillow Rent Index, here.
[3] A property is considered new construction if it was built in the calendar year of, or before, the listing year. In this analysis, the rental listing years included were 2015 and 2016, so new construction is anything built in 2014 and on.

