Welcome to the New Zillow Research: More Data, More Discovery, Same Mission

Regular visitors to the Zillow Research website may have noticed some changes lately. We’ve redesigned our site, adding a few new features designed to showcase more of our data, more quickly and to make our research more discoverable and easier to consume on-the-go on mobile devices.
But while we’ve changed a few things around, all of the same tools and resources are still available—with a few added features. And our goal remains the same as always: To produce and publish the best real estate and economic research and analysis, for a diverse audience of consumers, media, analysts, policymakers and academics.
Here’s a quick rundown on what’s new, what’s changed and how to get the most out of the new Zillow Research.
Perhaps the most visible change to the new site is the addition of a series of data tiles near the top of the page. These are designed to give visitors top-line Zillow data on home values, rents, negative equity, affordability and more, all at a glance.
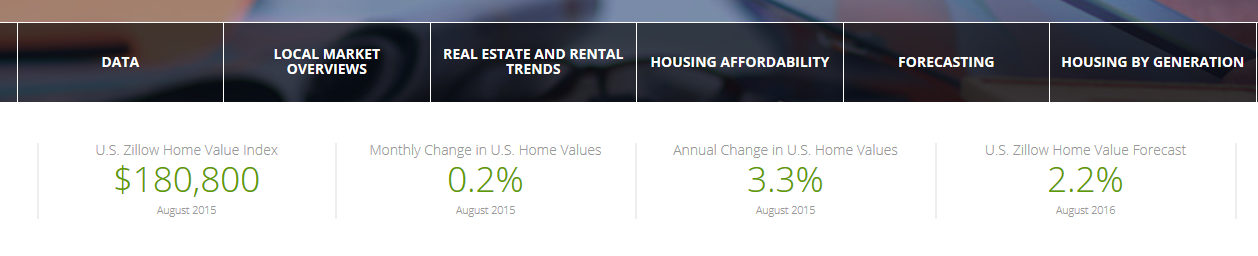
Which page you’re on will determine what kind of data you see. Visit the page for housing affordability, for example, and you’ll see top-line data points related to Zillow’s housing affordability research. If you’re on our negative equity page, you’ll see negative equity data (more on these mini home pages for each housing research topic below).
All of these data points will be updated monthly or quarterly, as soon as the latest data is available.
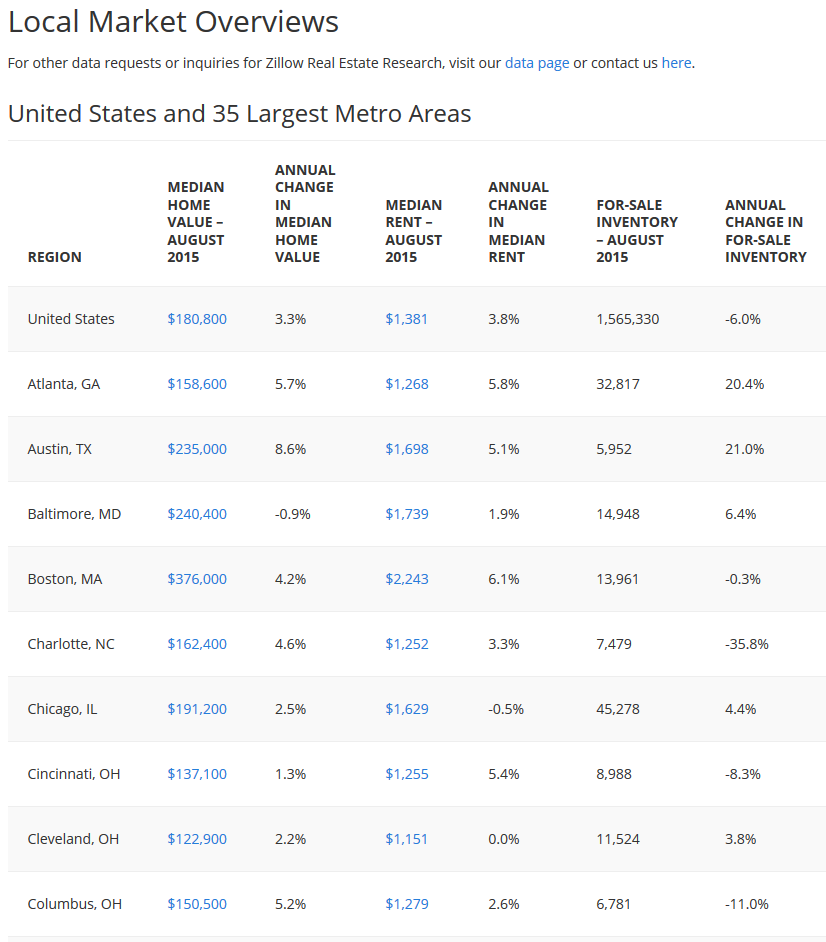
For years, we’ve published two-page, PDF market overviews on both rental and for-sale real estate for hundreds of local markets nationwide. And that hasn’t changed. Those reports are still published monthly, and organized by state on our market overviews page.
But now, instead of having to open individual files to get top-line data on individual metros, we’ve added a new table to the market overview page that offers top-line local data for the nation’s 35 largest metro areas. Curious how fast rents are rising in Riverside? What about home values in Vegas? All easy to find in one, clean table. And the rent and home value figures within the table itself also link back to the existing PDF home value and rental overview reports for each market, for those looking to take a deeper dive into local data.
For those looking to go even deeper, all of our individual datasets for dozens of metrics at the national, state, metro, county, city, ZIP code and neighborhood level are freely available to download as CSV files from our data page. Can’t find what you’re looking for, or have questions? Let us know and we’re happy to work with you whenever possible.
On our redesigned site, content is now organized both chronologically and by research topic. Only interested in real estate and rental trends? You can go right to the real estate and rental trends page to find what you’re looking for. These pages can easily be accessed from two areas.
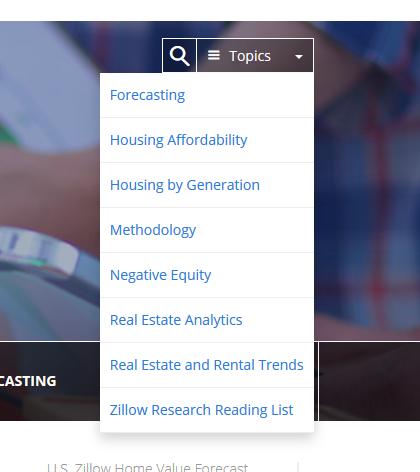
From the search menu in the top right-hand corner of the page:
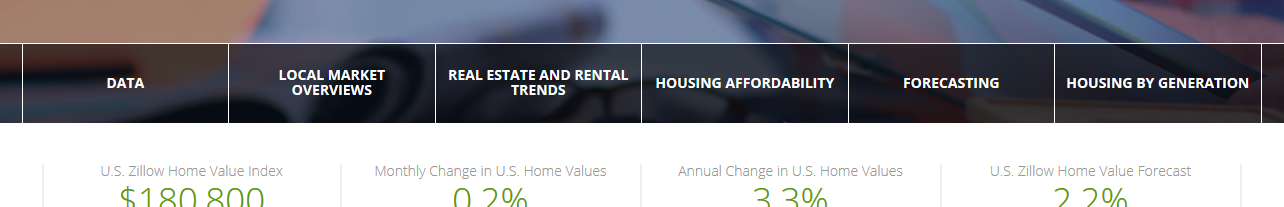
And from the navigation bar just above our data tiles:
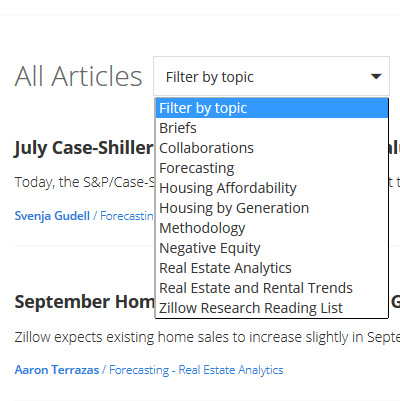
Specific content by topic can also be accessed from the drop-down menu just below our featured content boxes, without visiting individual content pages:
And speaking of those featured content boxes, those are new too. The idea is to feature not necessarily our newest research there, but our most important or most relevant. If minimum wage becomes a hot-button conversation topic again, we may resurface some of our existing minimum wage research there. Or if we recently came out with a new report on student debt, we may leave it in the featured area for a bit longer, to ensure our users can find it quickly.
Finally, we’ve also enabled users to search by author, to expose as many readers as we can to the real estate economics rock stars we have on staff. Love Director of Economic Product & Research Krishna Rao’s regular reading lists? Just search for his byline. Can’t get enough of Senior Economist Aaron Terrazas’ work on mortgages, housing by generation, rents and pretty much everything? He’s easy to find.
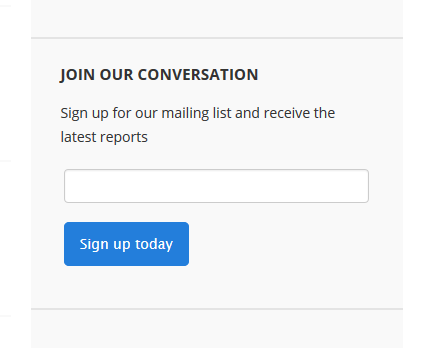 More Conversation
Earlier this year, we began sending regular email roundups of our most relevant and recent research to our growing email contact list of colleagues and partners. With the redesigned site, we’ve also made it easier to sign up for our regular emails. Just enter your email in the sign-up box on the right-hand column of most pages, and we’ll take it from there.
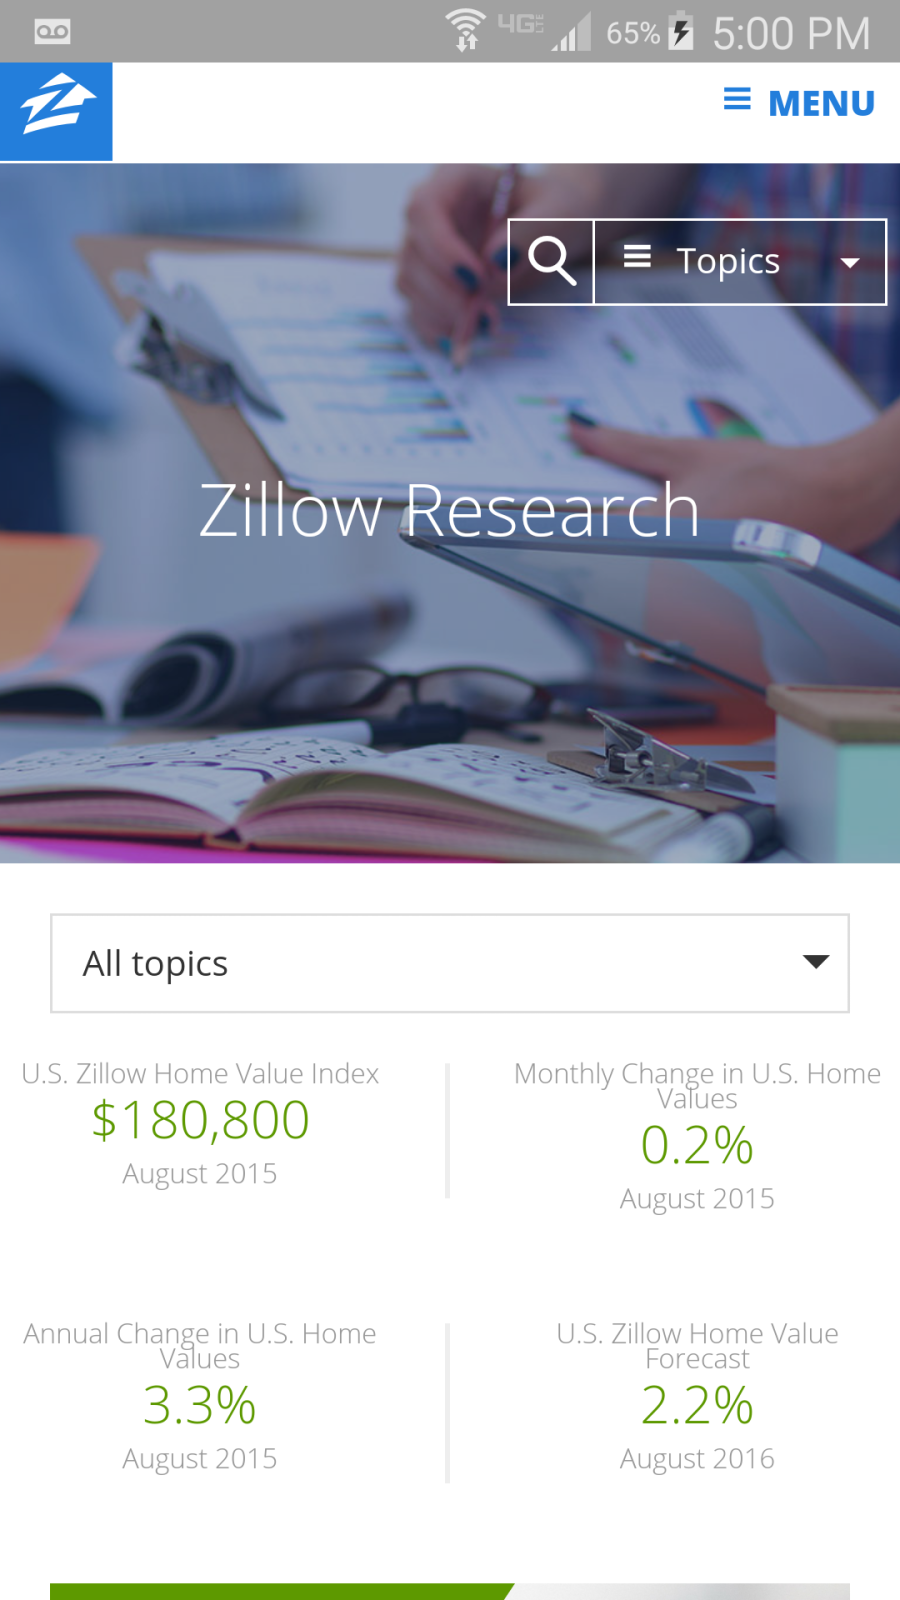 Our new site is better optimized to take advantage of the variety of phones, tablets, laptops and desktops people use to find and consume our data and research.
Depending on the width of your screen, the majority of content on our new site will automatically scale to fit your device, including our familiar data tables.
We hope you enjoy the new site, and find it easier to access the same research you’ve always come to rely on us for, and maybe discover some new information along the way. And while we’ve worked really hard to get to this point, we know our work isn’t done, and we’ll be rolling out new incremental changes from time-to-time over the next few weeks and months.
And if you have any questions or suggestions, we’d love to hear from you. Please feel free to drop us a line at researchfeedback@zillow.com
