- Press Releases
Sustainability
Social Impact
Explore how Zillow is driving real progress toward a more affordable and accessible housing market.
- Investors
- Careers
11 min read
Building a strong foundation to accelerate StreetEasy’s data science efforts

Introduction
Data is at the foundation of everything we do at StreetEasy and Zillow. Users of our websites and services can get recommendations through our homepage and tailored emails; they can read blog posts (such as this) that contain the latest trends and numbers; and they can even access data, such as existing inventory and prices, through our StreetEasy Data Dashboard.
Given the importance of data at StreetEasy, we recently set out to improve the quality and availability of our data. This blog post describes that journey.
Our challenge
There is a huge difference between data and easy-to-use data. The former can lead to bad decisions and sub-par experiences; the latter leads to a superb product and experience that enables the people who use our services to make quick, data-informed decisions. Let’s illustrate how that works.
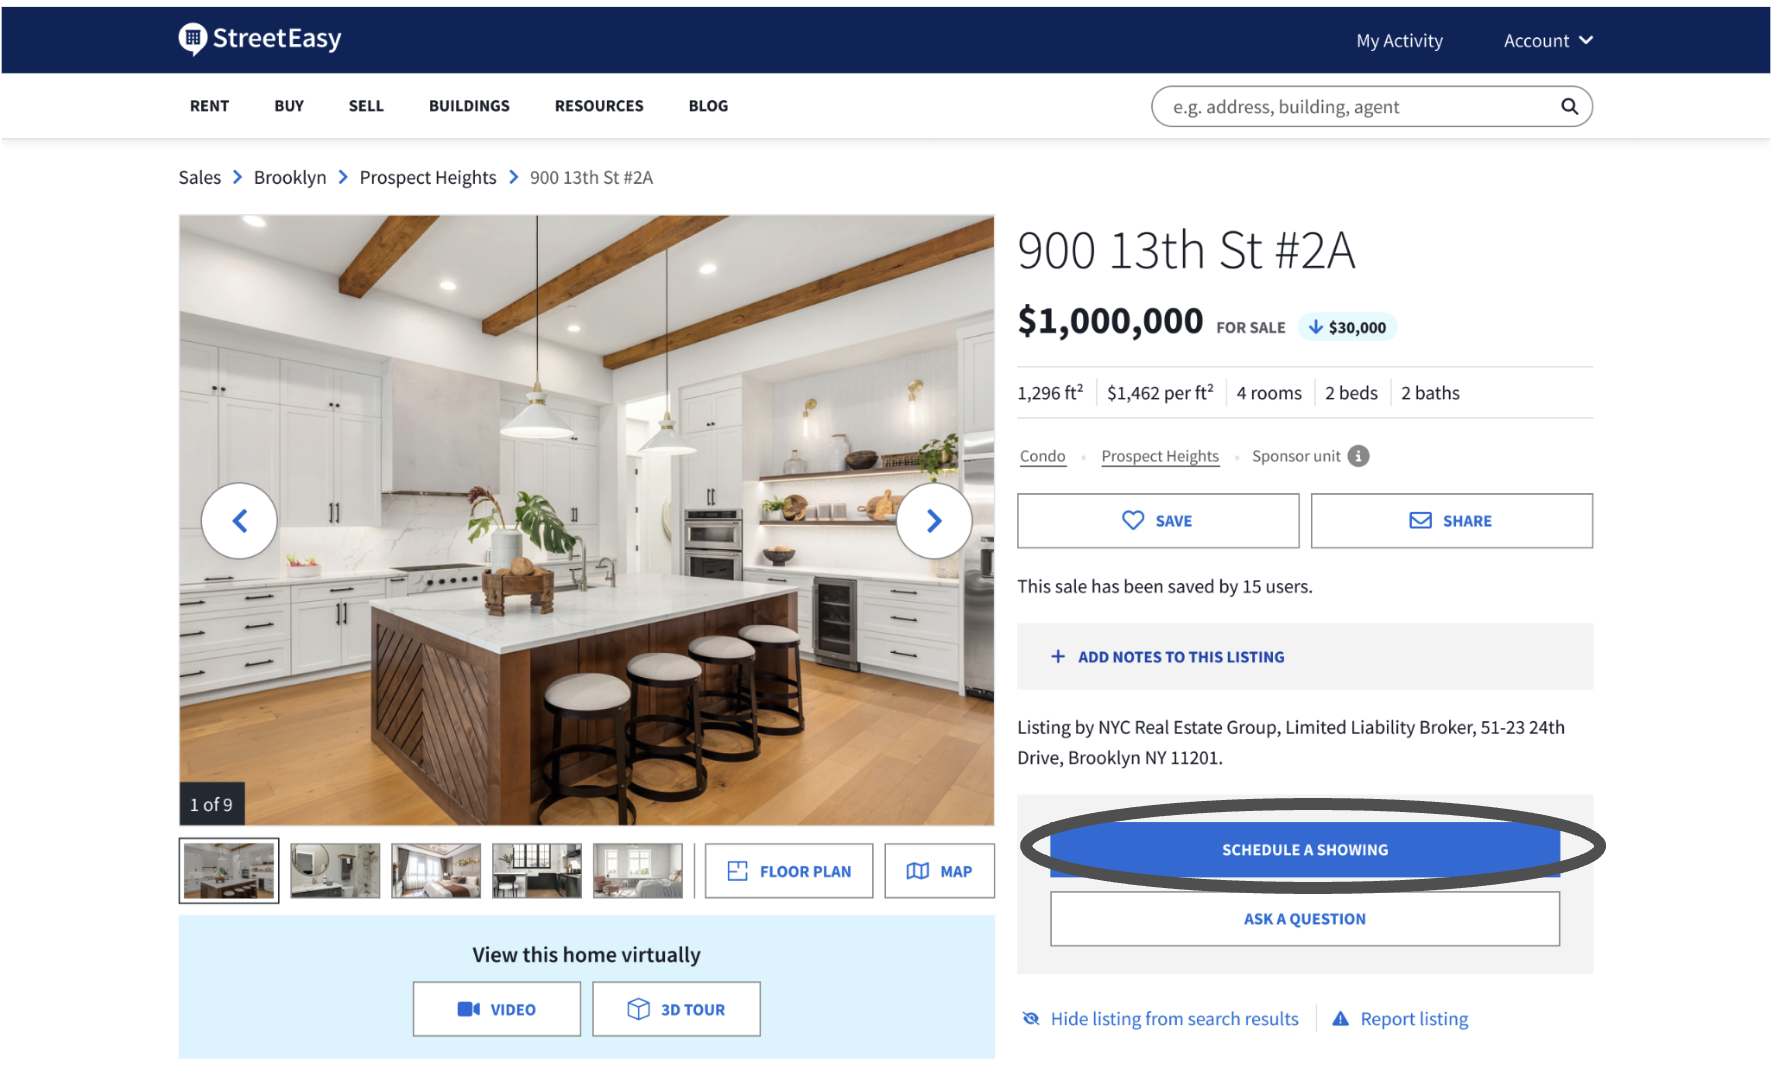 Example of a key user action we are interested in tracking.
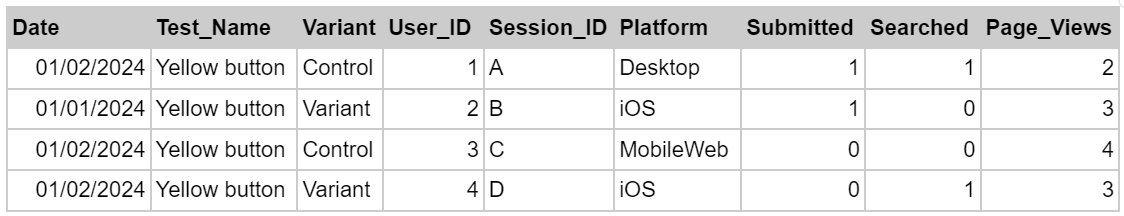
As the data team, we want to calculate the submit rate, i.e. the share of sessions that result in at least one submit. A submit is when a user clicks on the “SCHEDULE A SHOWING” button and submits a request (see image). The raw data that we log populates a large table of events (i.e. actions a user takes online) that contains billions of rows and hundreds of columns. But before it can be used to answer even the simplest of questions, the data (shown in the table below) must be transformed.
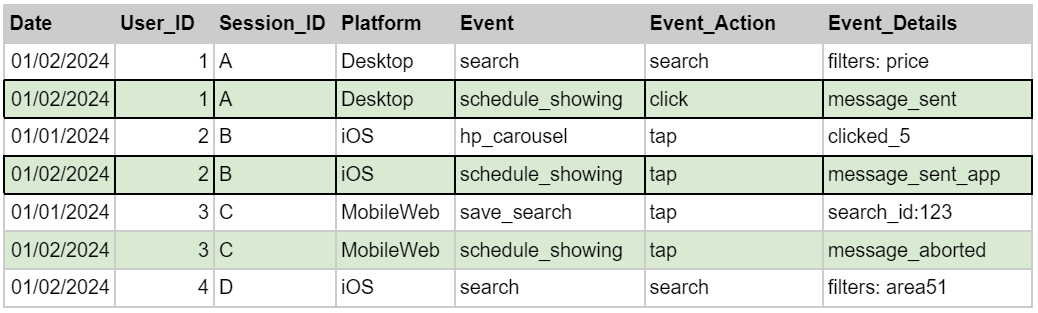 Illustrative example of raw event data. While our actual data looks quite different, this example clearly illustrates some of the practical data challenges our team used to encounter.
For example, to calculate the submit rate, one needs to identify the event that corresponds to the action we are interested in. One can do this by finding the schedule_showing event and filtering for those instances when a message was sent (Event_Details = message_sent or message_sent_app). There is a lot of nuance in the data, such as:
- The analyst needs to know that when Event_Details = message_aborted, this means a message was not submitted (the user clicked on the schedule a showing button but then did not send the message). These events need to be excluded.
- The Event_Details field has slightly different values for the same action being performed on desktop versus our iOS app (message_sent vs message_sent_app), and one needs to make sure that both are calculated
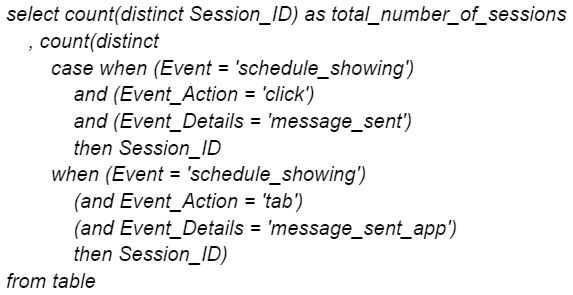
If we were to write a SQL query to do this, it would look something like the following (this example is illustrative and not an actual SQL query):
This example shows the difference between data and easy-to-use data. While the data is technically available and one can calculate all sorts of metrics, the process is difficult, cumbersome and error prone. This can lead to a variety of issues, such as:
- Slow turn-around times: Even the most basic analyses used to take a long time. For example, answering a simple question in an A/B test (e.g. is KPI X better in the new variant we are testing) could take hours/days because of the complexity of our data.
- Lack of reliability/reproducibility: Since analysts had to build complex logic to calculate even the most basic KPIs, it was easy for them to make a mistake and to get different values for the same KPI.
- Inability to self-serve: Very few people outside the Data Science team had the knowledge and know-how to run any analysis.
In the remainder of this blog post we will explain how we overcome these issues.
Transforming our data into easy-to-use data
The issues described here have to do with the transformation layer in ETL/ELT. Data needs to be transformed into a format that makes analyses easy, reproducible and reliable. The table below offers an example of what this means. It summarizes the activity that happened in each session and transforms the raw data, making analyses very easy. For example, the column “Submitted” tells you whether or not there was a submit in that session. The average of that column is the submit rate, which can be calculated with two lines of very basic SQL.
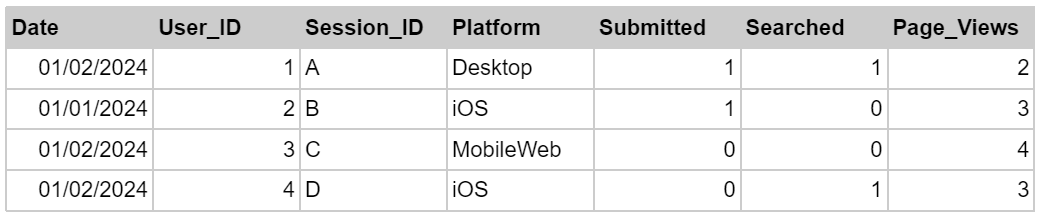 Illustrative example of a certified dataset.
There are countless advantages to transforming the data in such a way. A few highlights are:
- Reproducibility: The logic to calculate specific metrics (say submit rate) has to be defined once and then can be leveraged by everyone at the company.
- Speed and cost savings: Because the data is transformed once (this includes joining different tables, which is computationally expensive), querying these transformed tables is a lot faster. Also, since the data is only transformed once, it will reduce costs (as opposed to transforming data every time somebody runs an analysis or a dashboard).
- Ease: Analyzing and querying these tables is exponentially easier, which means that more people at the company can self-serve.
The main tool we used to achieve this is dbt, a data transformation tool that enables data analysts and engineers to transform data in a cloud analytics warehouse. Dbt allows us to orchestrate these transformations at scale and have the entire team contribute to this project. In our case, hundreds of tables (from different applications) are processed into tens of certified datasets every few hours. These datasets share a few important properties:
- Certified: these datasets have been developed by a cross-functional team made up of data scientists, applied scientists and data engineers. Each dataset has been thoroughly reviewed and discussed. Metrics definitions have been agreed upon and follow our company’s best practices. We have set-up automated tests to ensure the data is always of high quality.
- Documented: dbt allows users to document their datasets by providing descriptions for each field. Furthermore, we created internal documentation for some of our key datasets that explains how they are created and how they can be used.
- Fast and easy to query: Because the data is already transformed and is in a simple and intuitive format, analysts (and stakeholders) can easily query the data and get answers quickly.
The schematic below explains the process of transforming this data at scale.
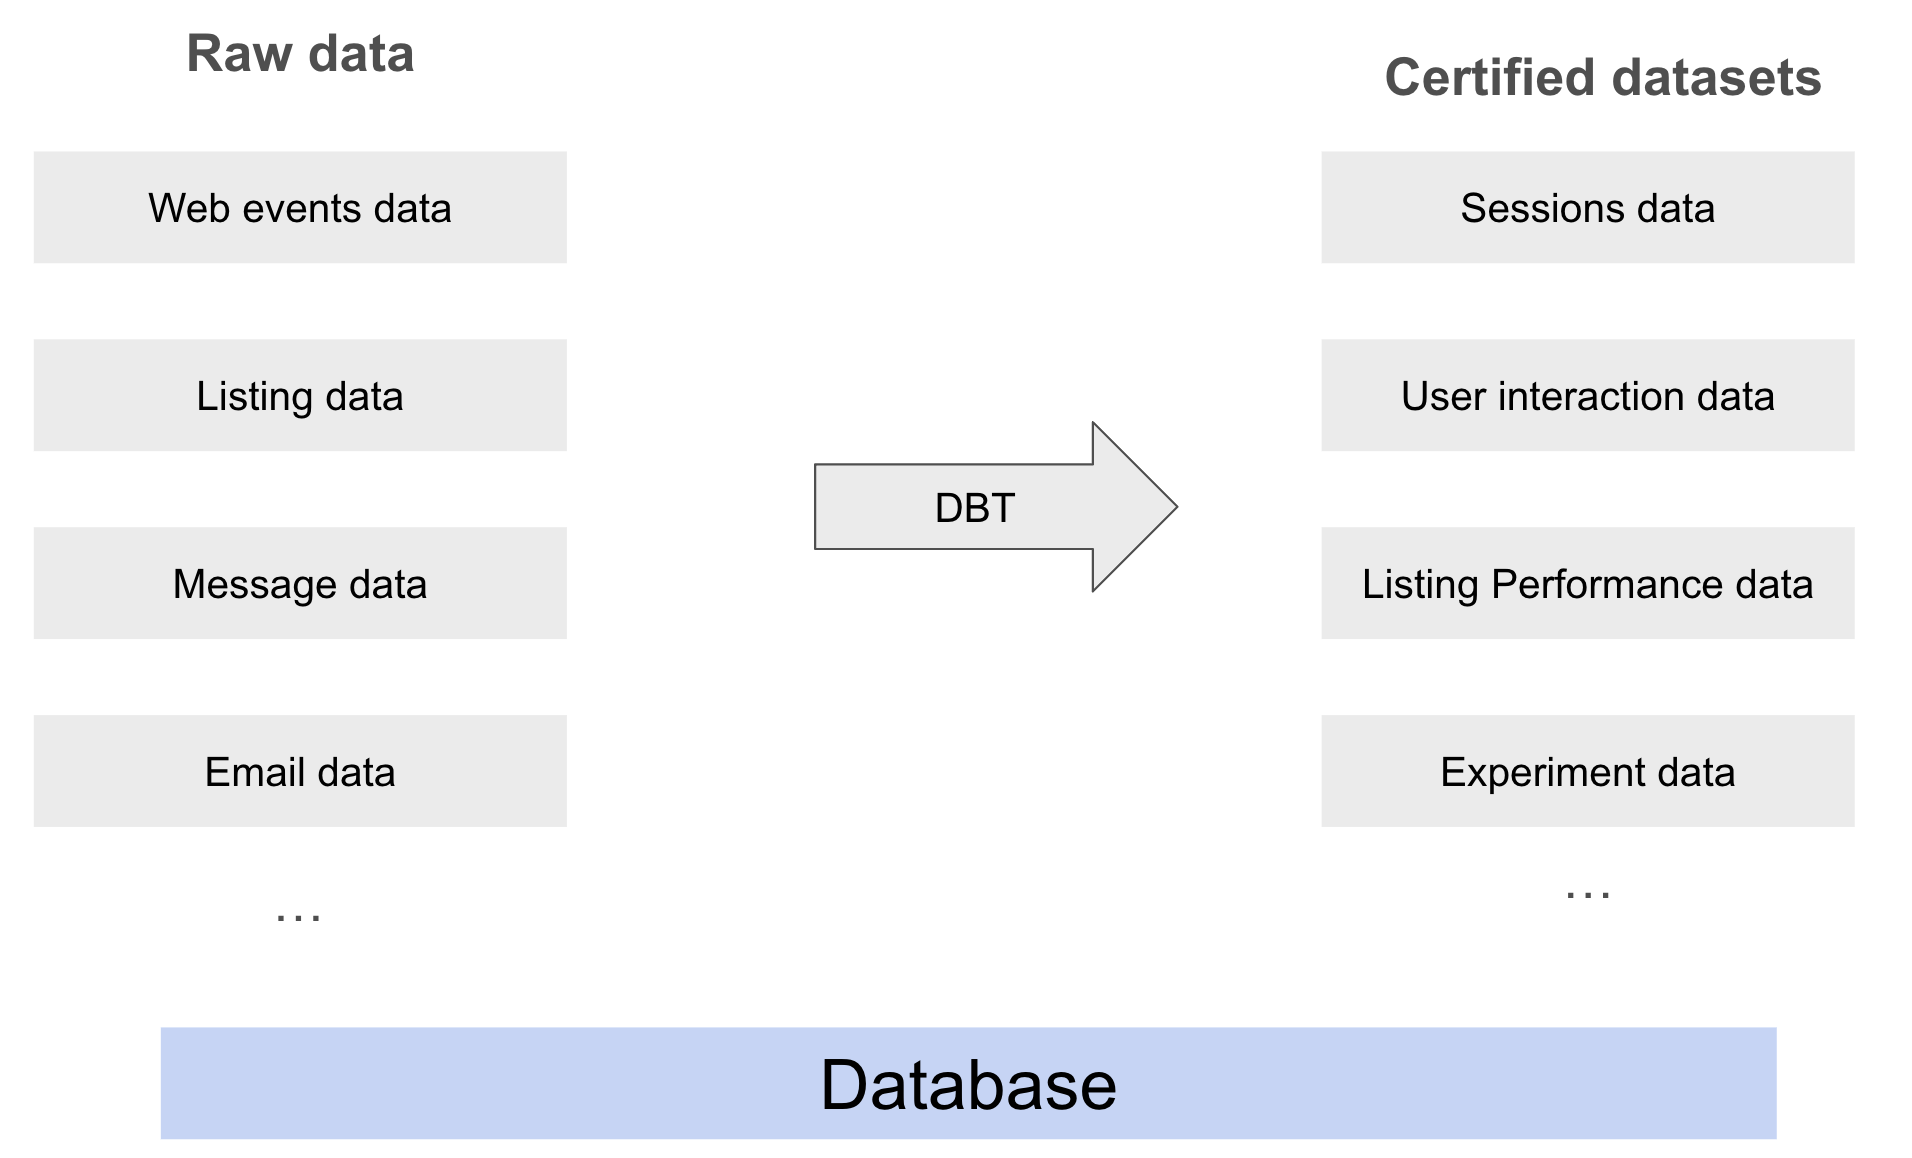 Schematic of how our raw data gets transformed into certified datasets.
Test cases for certified datasets
The creation of certified datasets has completely changed how we run data analysis and allowed us to be much faster as a team. Below we discuss a few examples
A/B test reads
Prior to creating our certified datasets, running even a simple A/B test was a challenging proposition. Each test needed an ad-hoc, complex SQL query that pulled specific metrics from our raw data. So we created a slightly different version of the sessions table that included information about which experiment and variant a session belonged to (see below). This table makes it trivial to analyze and quantify any change in the session metrics for a specific test, all one has to do is a group by in SQL.
 Illustrative example of a certified dataset for our experiment data.
One of the benefits of this certified dataset is the ability to automate A/B test analysis. Indeed, we have created a dashboard through which a user can input the test name and quickly generate a view of how different standard metrics are performing. A statistical analysis can also be done on the fly, and users can quickly see if the lifts in their metrics are 95% significant.
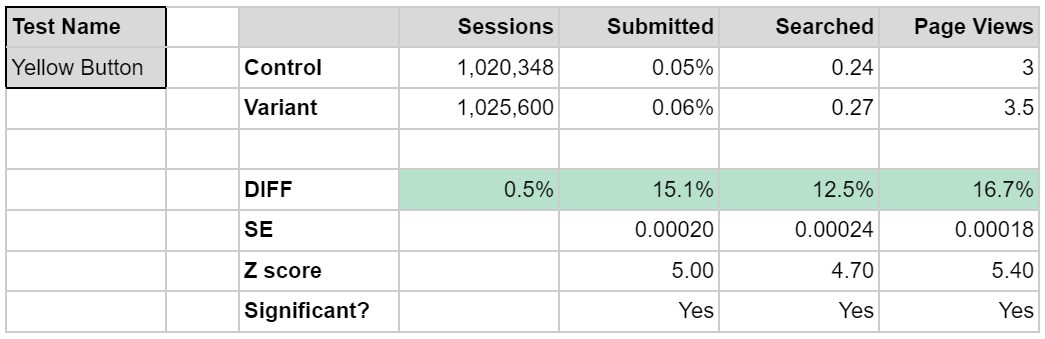 Illustrative example of a dashboard that tracks the results of an experiment. In this experiment, the user can quickly see that the variant leads to statistically significant lifts in some KPIs.
Quick model development
Access to accurate, reliable and documented data also makes ML model development much faster and easier. This became evident in a recent project that required a model that would predict whether a lead (when we connect an agent to a potential buyer) would result in a real estate transaction with that agent. The goal of this project was to prove the feasibility of this endeavor and make the case for investing more in this area.Luckily, the team had already worked to provide access to a certified data set that was clear, well-structured and documented. So we could plug that data set directly into our model, and in less than a day we had a good prototype that proved our ability to make these predictions. This level of fast turnaround was unthinkable in the past, and has led to that project being prioritized on our roadmap.
Self-serve analytics
The ability to conduct self-serve analytics is one of the holy grails in our field. Many vendors claim that they can provide everyone at a company access to all of its data, without writing a single line of SQL or having to know any data nuance. Reality is more complex. StreetEasy’s journey to self-serve analytics has evolved over time. We quickly abandoned the hope that a single tool would allow everybody to access all the data and to run any analysis they want. Instead, we created a pragmatic, multi-pronged approach that gives our stakeholders a variety of data access options.
Our approach is based on a key insight: about 80% of the data queries are frequently asked (e.g. how many users do we have for each platform?). Some of these questions are trivial (e.g. the user breakdown by platform), while others are trickier.
But because they are frequently asked, they are a perfect use case for automation, i.e. creating a dashboard that everybody at StreetEasy can access. The remaining 20% of these questions will be ad-hoc and exploratory. This is a natural and healthy outcome of continuously pushing the boundaries of our business and looking for new opportunities, which leads to always asking new questions and running new analyses.
Based on what we described above, our approach is made up of three pillars; the first pillar addresses the frequently asked questions, while the last two are for ad-hoc and exploratory data analysis.
- Certified dashboards: The dashboards address the 80% of questions that are frequently asked. To this end, we built high-quality dashboards on top of our certified datasets. The metrics reported in them are clearly documented and have been studied and agreed upon by our stakeholders. Gone are the times when different stakeholders would report different values for the “same” metrics.
- 80-20 analytics: This refers to the ability of a data scientist to answer 80% of a question with 20% of the work. Using this approach, the vast majority of new questions should be answered in a matter of minutes. This is best explained with an example. A while ago, we wanted to understand how often a user would click the “go back” button on their browser. That information was not readily available in our data, and answering this question with 100% certainty would have required a significant investment of time. Instead, we looked at how often a user browsed the same url in a session and used this as a proxy. The information we obtained was enough to answer the primary business question, and led to a positive change in our user experience.
- Stakeholder self-serve: Many of our stakeholders are proficient in SQL and data analysis and are quite happy to self-serve, given the right circumstances. In order to encourage this, we are working hard to create the right conditions. Our certified datasets are simplifying many analysis projects, thus reducing the barrier to entry. We are also making sure we have good documentation and have started a series of training sessions on a variety of topics (e.g. how to use certain datasets, how to use Tableau, etc.). While we don’t expect everybody at StreetEasy to become a data scientist, we definitely want to empower anybody who wants to.
Conclusions and what’s next
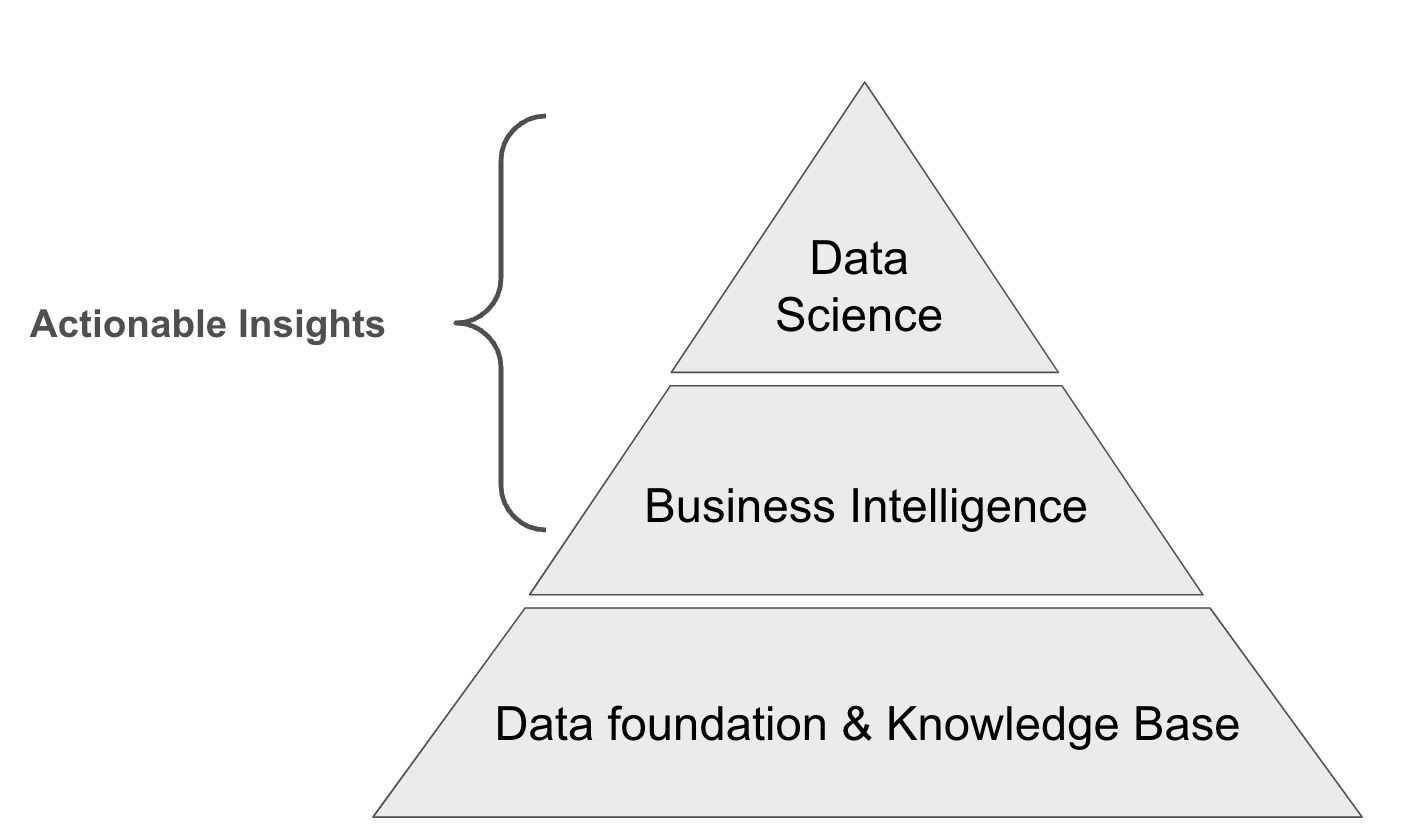
When one thinks about leveraging the power of data to create a better product and experience for their users, it can be helpful to think about the process a bit like building a pyramid: We all want to leverage Business Intelligence and Data Science to provide actionable insights for the business (the top parts of the pyramid). But before anything else can be done, you need a strong (data) foundation. The work described in this blog post allowed us to build this foundation; we’re now enjoying the fruits of our labor (the top of the pyramid).
Acknowledgements
This project was a real team effort and therefore there are many people to thank. A special thanks to Lisa Karaseva, Deans Charbal, Boian Filev who spearheaded using dbt to create our first certified datasets. Similarly, thanks to Nancy Nan, Claire Tu, Illia Maliarenko, William Wallace for creating and reviewing our certified datasets.
StreetEasy is an assumed name of Zillow, Inc. which has a real estate brokerage license in all 50 states and D.C. See real estate licenses.
Related Articles


Sign up for Zillow news updates
Subscribe to receive daily emails for the latest Zillow news and announcements, product updates and more.
%20--%3e%3cdefs%3e%3cstyle%3e%20.st0%20{%20fill:%20%23111116;%20}%20%3c/style%3e%3c/defs%3e%3cpath%20class='st0'%20d='M.67,84.17v-9.38L39.19,20.75v-1.12H1.34V4.67h62.64v9.38l-37.85,54.04v1.12h38.97v14.96H.67Z'/%3e%3cpath%20class='st0'%20d='M75.04,9.36c0-5.58,4.13-9.71,9.94-9.71s9.94,4.13,9.94,9.71-4.13,9.71-9.94,9.71-9.94-4.02-9.94-9.71ZM76.71,84.17V27h16.53v57.17h-16.53Z'/%3e%3cpath%20class='st0'%20d='M106.3,84.17V1.32h16.53v82.85h-16.53Z'/%3e%3cpath%20class='st0'%20d='M135.33,84.17V1.32h16.53v82.85h-16.53Z'/%3e%3cpath%20class='st0'%20d='M161.79,55.58c0-18.42,12.62-30.37,31.71-30.37s31.71,11.95,31.71,30.37-12.73,30.37-31.71,30.37-31.71-11.95-31.71-30.37ZM208.58,55.58c0-9.49-6.25-16.19-15.07-16.19s-15.18,6.7-15.18,16.19,6.25,16.3,15.18,16.3,15.07-6.81,15.07-16.3Z'/%3e%3cpath%20class='st0'%20d='M246.32,84.17l-17.2-57.17h16.86l11.61,40.64h1.12l10.16-40.64h16.53l10.94,40.98h1.12l11.39-40.98h16.41l-17.31,57.17h-21.55l-8.71-37.85h-1.12l-8.6,37.85h-21.66Z'/%3e%3cpath%20class='st0'%20d='M362.44,84.17V4.67h56.94v15.86h-38.3v17.53h33.5v14.51h-33.5v31.6h-18.65Z'/%3e%3cpath%20class='st0'%20d='M428.76,84.17V27h16.3v7.82h1.23c2.46-5.36,8.04-8.93,14.07-8.93,2.34,0,4.69.56,6.48,1.45v14.85c-3.24-1.45-7.03-2.12-9.38-2.12-7.26,0-12.17,6.03-12.17,14.85v29.25h-16.53Z'/%3e%3cpath%20class='st0'%20d='M471.64,55.58c0-18.42,12.62-30.37,31.71-30.37s31.71,11.95,31.71,30.37-12.73,30.37-31.71,30.37-31.71-11.95-31.71-30.37ZM518.43,55.58c0-9.49-6.25-16.19-15.07-16.19s-15.18,6.7-15.18,16.19,6.25,16.3,15.18,16.3,15.07-6.81,15.07-16.3Z'/%3e%3cpath%20class='st0'%20d='M545.11,84.17V27h16.52v8.04h1.12c4.24-6.48,9.71-9.71,16.64-9.71,12.95,0,21.55,10.05,21.55,23.78v35.06h-16.52v-32.72c0-7.03-4.02-11.95-10.72-11.95s-12.06,5.25-12.06,12.51v32.16h-16.52Z'/%3e%3cpath%20class='st0'%20d='M617.13,65.74v-26.69h-8.04v-12.06h8.49l3.24-18.09h12.95l-.11,18.09h13.06v12.06h-13.06v26.02c0,4.8,2.9,8.04,7.59,8.04,1.56,0,4.02-.33,5.92-.78v11.84c-3.24,1.12-7.93,1.79-11.17,1.79-11.5,0-18.87-8.15-18.87-20.21Z'/%3e%3cpath%20class='st0'%20d='M686.58,84.17V4.67h34.95c19.43,0,31.93,10.27,31.82,26.69,0,16.3-12.62,26.8-31.93,26.8h-16.52v26.02h-18.31ZM704.89,44.08h15.07c9.16,0,14.85-5.02,14.85-12.73s-5.81-12.62-14.85-12.62h-15.07v25.35Z'/%3e%3cpath%20class='st0'%20d='M757.71,55.58c0-18.42,12.62-30.37,31.71-30.37s31.71,11.95,31.71,30.37-12.73,30.37-31.71,30.37-31.71-11.95-31.71-30.37ZM804.49,55.58c0-9.49-6.25-16.19-15.07-16.19s-15.19,6.7-15.19,16.19,6.25,16.3,15.19,16.3,15.07-6.81,15.07-16.3Z'/%3e%3cpath%20class='st0'%20d='M831.17,84.17V27h16.3v7.82h1.23c2.46-5.36,8.04-8.93,14.07-8.93,2.34,0,4.69.56,6.48,1.45v14.85c-3.24-1.45-7.03-2.12-9.38-2.12-7.26,0-12.17,6.03-12.17,14.85v29.25h-16.52Z'/%3e%3cpath%20class='st0'%20d='M874.16,55.58c0-18.2,12.62-30.37,31.04-30.37,15.52,0,27.36,8.71,29.25,22.22l-15.41,2.01c-1.45-6.25-7.26-10.61-13.62-10.61-8.37,0-14.74,6.92-14.74,16.75s6.25,16.75,14.63,16.75c6.59,0,12.17-4.35,13.73-10.5l15.52,1.9c-2.12,13.51-14.07,22.22-29.37,22.22-18.2,0-31.04-12.28-31.04-30.37Z'/%3e%3cpath%20class='st0'%20d='M944.73,84.17V1.32h16.52v33.39h1.12c4.35-6.25,9.71-9.49,16.64-9.49,12.95,0,21.66,10.05,21.66,23.67v35.28h-16.52v-32.83c0-7.03-4.13-11.95-10.83-11.95s-12.06,5.25-12.06,12.62v32.16h-16.52Z'/%3e%3c/svg%3e)
