Building the Neural Zestimate
Zillow’s signature home valuation tool — the Zestimate — is a powerful starting point in determining a home’s value. Since its launch in February 2006, the Zestimate has evolved from providing 40 million homes with an estimated home value updated monthly to covering more than 100 million homes in the U.S. with estimates that react to market trends several times a week, all while improving the accuracy of the estimates themselves. The evolution of the Zestimate has been enabled by transformative advances in machine learning and artificial intelligence over the past decade.
In June 2021, we launched significant upgrades to the Zestimate by drawing on advances in deep learning to develop a new system — dubbed internally the “Neural Zestimate.” The new system enables the Zestimate to react more quickly to current market trends on a national scale. It also radically simplifies the maintainability of the system, while yielding substantial accuracy gains. And it does all of this on a national scale.
Zestimating the Nation
The Neural Zestimate is Zillow’s best estimate of the market value for homes that are not actively listed for sale. Every home in the U.S. — more than 100 million in total — gets a Neural Zestimate, which incorporates property data such as sales transactions, tax assessments and public records, and home details such as square footage and location.
At any given time, many hundreds of thousands of homes nationwide are listed for sale, with several million homes selling each year. For actively listed homes, the Zestimate leverages many of the same home facts as non-listed homes, but also incorporates signals about a homeowner and agent’s listing strategy and the observed listing history.
The Zestimate requires processes and models that are scalable and effective across a wide diversity of home types. So how is the Neural Zestimate different from prior Zestimates?
Previous Zestimates
Previously, the Zestimate used a pipeline of tasks where separate models handled different aspects of the home valuation process, typically at the resolution of fixed and relatively small regions like counties. These distinct processes looked something like:
- Calculate regional home price movements (appreciation and depreciation) over time.
- Adjust historical sale prices according to the regional appreciation or depreciation.
- Learn an ensemble of models to estimate the adjusted sale prices from feature data.
- Combine the ensemble of estimates into a single best estimate.
Although the older system reflected assumptions around local pricing mechanics that drive home values, it also had substantial downsides. Having many separate models increased the complexity of the overall system, and made it challenging to maintain and improve. It also prevented us from jointly optimizing over the components of the valuation process. For example, the model that learned to adjust historical sale prices was trained independently of the models that learned to estimate the adjusted sale prices from feature data.
Of course, this four-step approach, while serving the Zestimate well for many years, is just one of many different systems for estimating sale prices — each one with its own set of trade-offs. Wouldn’t it be great to see these trade-offs in action? Enter the Zillow Prize!
Insights from the Zillow Prize
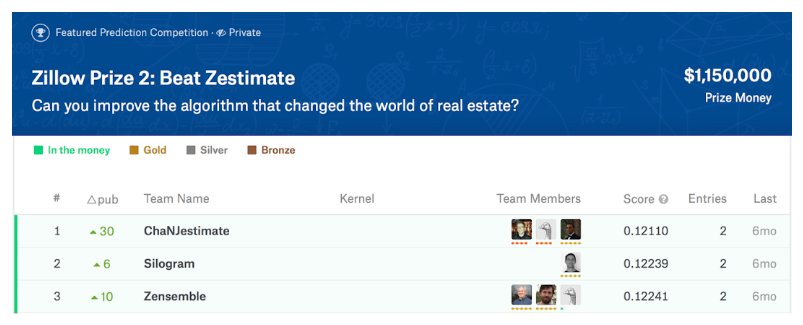
The Zillow Prize was a $1 million grand prize home valuation prediction competition — hosted in collaboration with the data science service Kaggle — that ran for 20 months from 2017 to 2019. With one of the largest prize pools on Kaggle before or since, the competition drew a large number of competitors from across the globe: more than 3,700 teams from 91 countries signed up. The winning team beat the Zillow benchmark by about 13 percent.

While the data used in the challenge included millions of transaction records and dozens of features, it still constituted only a fraction of the data available — and necessary — for generating nationwide Zestimates. So how did we go about translating the varied insights in a data science contest to real-world improvements?
We first started by looking at the broad trends within the many brilliant, independent solutions to the same challenging problem. Most solutions employed a suite of models and data cleaning techniques woven together by thousands of lines of code (one solution was just 371 lines!).
Two broad modeling approaches became apparent: 1) Use a traditional ML model with carefully engineered features; or 2) Carefully architect a neural network with the raw data as input. Remarkably, the latter packed what are traditionally separate processes into a single model — and, perhaps unsurprisingly, was a key component of the winning solution.
Architecting a Neural Model
The Neural Zestimate takes as much information as possible — many years worth of home details, geography, tax assessments, sales transactions and more — and integrates it into a single national-scale model. Rather than having to maintain thousands of independent, region-specific models, it leaves us with a single process. In the Neural Zestimate, the previously disjointed processes are learned and performed jointly in such a way as to produce the best estimate possible.
As any agent will know, real estate prices are heavily driven by the local market. It’s important that a national model is able to effectively incorporate local information into the learning process. To do this, location must be represented at a very fine granularity, which can be a challenge for traditional ML methods due to the high cardinality of geographical features. But it is one of the strengths of deep learning approaches like the Neural Zestimate, which can learn rich categorical embeddings.
To represent geography, we combine standard regional information with an approach borrowed from geospatial information systems — geographic tiling. There are several popular methods for performing geographic tiling, such as Google S2 and Uber H3. We use discretized geographic tiles at multiple scales of resolution with predetermined grid sizes, as illustrated below.
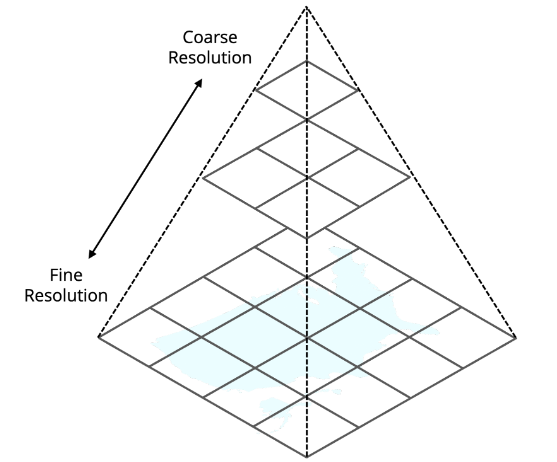

We then treat each grid cell as a categorical value and each level in the grid hierarchy as a separate categorical feature, allowing us to use these discrete cells as overlapping categorical feature values at multiple scales of representation. Altogether, this process allows the model to learn from the nuances that drive local real estate markets, as well as broader trends at the state and national level.
Time is also a crucial driver of real estate markets. The value of a home can change over time due to market effects, such as changes to mortgage rates or the number of properties currently available for sale. In a typical year, house prices also follow a seasonal cycle of peaks and troughs. So when it comes to building valuation models, it is important to ensure that time is represented in a way that captures these effects.
There are several ways to represent time in a model. One approach is to encode different time scales — the year and month of a sale, for example — as categorical variables for the model to learn. The downside is that there is no guarantee of continuity between these variables. For example, if the month of the year was encoded using a one-hot encoding scheme, then ordering of the months is lost in the learning process. Similarly, with a category encoding, a change in year could lead to a step change in the effect on price, creating very different values between December 31 and January 1.
Alternatively, we discretize time and treat it as a continuous feature. To give an inductive bias for seasonality, we borrow from time series analysis and decompose time into trend and seasonal components, as illustrated below.
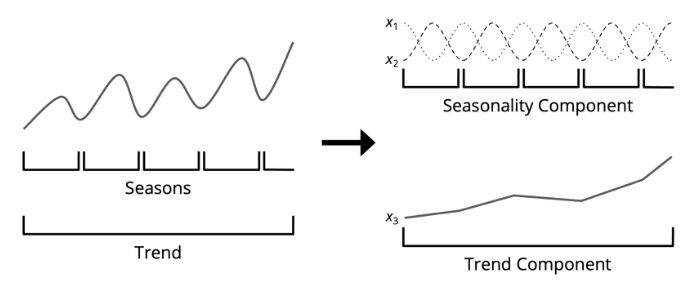

The trend component represents the long-term direction, which can be represented by a numerical feature that ranges the full timespan of the training data. The seasonal component represents systematic, calendar-related movements and can be composed as a set of cyclical features, ensuring that the end of one season is proximate to the start of another season. Decomposing time in this way means that the Neural Zestimate produces estimates that can gracefully keep pace with an ever-changing real estate market.
Of course, there are many more factors that go into determining a home’s sale price. We join the above geospatial and temporal features together with many other numerical and categorical features to estimate sale prices, such as the number bedrooms and bathrooms, the total square footage of the home and the type of property. With all of these factors learned together, we are able to train the model over a longer time span of historical data than previously possible. But we know that the final sale price of a home reflects factors that go beyond those amenable to modeling, such as buyer and seller preferences, liquidity and urgency.
To capture the uncertainty introduced by these and other factors, we employ quantile regression. With quantile regression, we can train the model to go beyond estimating a simple point value and to instead produce several estimates under different conditions. For example, quantile regression allows us to produce estimates of the minimum or maximum values that can be expected under a specific set of conditions, in addition to the most likely.
We use quantile regression to produce an interval for the Neural Zestimate, which encompasses the spectrum of potential sale prices that we estimate to be most likely given the data available. This shows up as a Zestimate range, in addition to the value estimated most likely. When this range is sufficiently large, we use it as a signal that the uncertainty in our estimate is too high and suppress the Zestimate.
Measuring the Impact
The national accuracy of the Zestimate is measured by aggregating sales that occur in a timeframe after the training data for the model and comparing our modeled estimates to the actual observed sale prices. During model development, we employ this evaluation process through backtesting, where we train and evaluate the model on historical data.
Now, more than a year after the initial release of the Neural Zestimate, we have data representing millions of real-world sales. We have been extremely pleased to see relative error rates decline by more than 15% nationally, an improvement that is even larger than that demonstrated by the winning Zillow Prize solution over the Zillow benchmark. The median error rate of the Zestimate currently stands at 7.49% across estimates given to more than 100 million off-market homes.
The model has proven resilient over a period with historical and unprecedented changes in housing activity, tracking the ups and downs of prices with limited statistical bias (under- or over-valuation). This means that it is roughly equally likely for this estimate to be above the sale price as it is to be below. By transitioning to the Neural Zestimate, we have also reaped the benefits of reducing the number of models that we have to train, deploy and maintain in production. This means that Zestimates can be calculated faster and at a fraction of the previous cost.
The development of the Neural Zestimate served as an opportunity to leverage Zillow’s nascent AI Platform, a machine learning platform solution that has proven successful at radically lowering the barriers to experiment, iterate and deploy models into the Zillow ecosystem. As a result, experimenting with and deploying upgrades to the Zestimate—incorporating new features or data, for example—has never been easier.
Additionally, a faster and more accurate Zestimate improves both the speed and quality of derivative products, metrics and models that depend on the Zestimate. One example of this is our Zillow Home Value Index (ZHVI), a rich set of indices tracking home value movement across many different submarkets that is used by industry professionals, academics, government agencies and consumers to better understand market movements.
Unlocking the Next Chapter
Zillow’s mission is to give people the power to unlock life’s next chapter. The Zestimate has been and continues to be a crucial part of that mission. At Zillow, we are committed to innovation that makes the Zestimate smarter and more accurate. So what might the Zestimate’s next chapter look like?
As a deep learning approach, the Neural Zestimate provides new opportunities for capturing the nuance of a home that goes beyond numbers. For example, as you browse a home on Zillow, the photos may catch your eye. You might skim a listing description, keeping an eye out for a mention of premium home features not captured by the numbers. Leveraging deep learning makes it easier to incorporate this sort of rich, multi-modal data that humans already use, like images and text. We are constantly iterating on ways to unlock new value, such as by incorporating listing descriptions into the Zestimate.
Improving the Zestimate is not just about the type or quantity of data—quality also matters. As our models become more sophisticated and the amount of data consumed increases, it will be crucial to ensure that the quality of data remains high. We are excited by work to improve the quality of our data and to explore new data sources.
The flexibility and composability of a deep learning model also provides an avenue for layering on additional models —such as an estimation of the likely time until a home will sell—that can help our customers better understand their local real estate market dynamics.
If you are interested in unlocking a new chapter and building the next generation of machine learning tools for real estate, we’d love to hear from you. Zillow is hiring (fully remote!).